Iroquois vs Immigrants from Italy Median Family Income
COMPARE
Iroquois
Immigrants from Italy
Median Family Income
Median Family Income Comparison
Iroquois
Immigrants from Italy
$90,543
MEDIAN FAMILY INCOME
0.2/ 100
METRIC RATING
271st/ 347
METRIC RANK
$112,848
MEDIAN FAMILY INCOME
99.4/ 100
METRIC RATING
74th/ 347
METRIC RANK
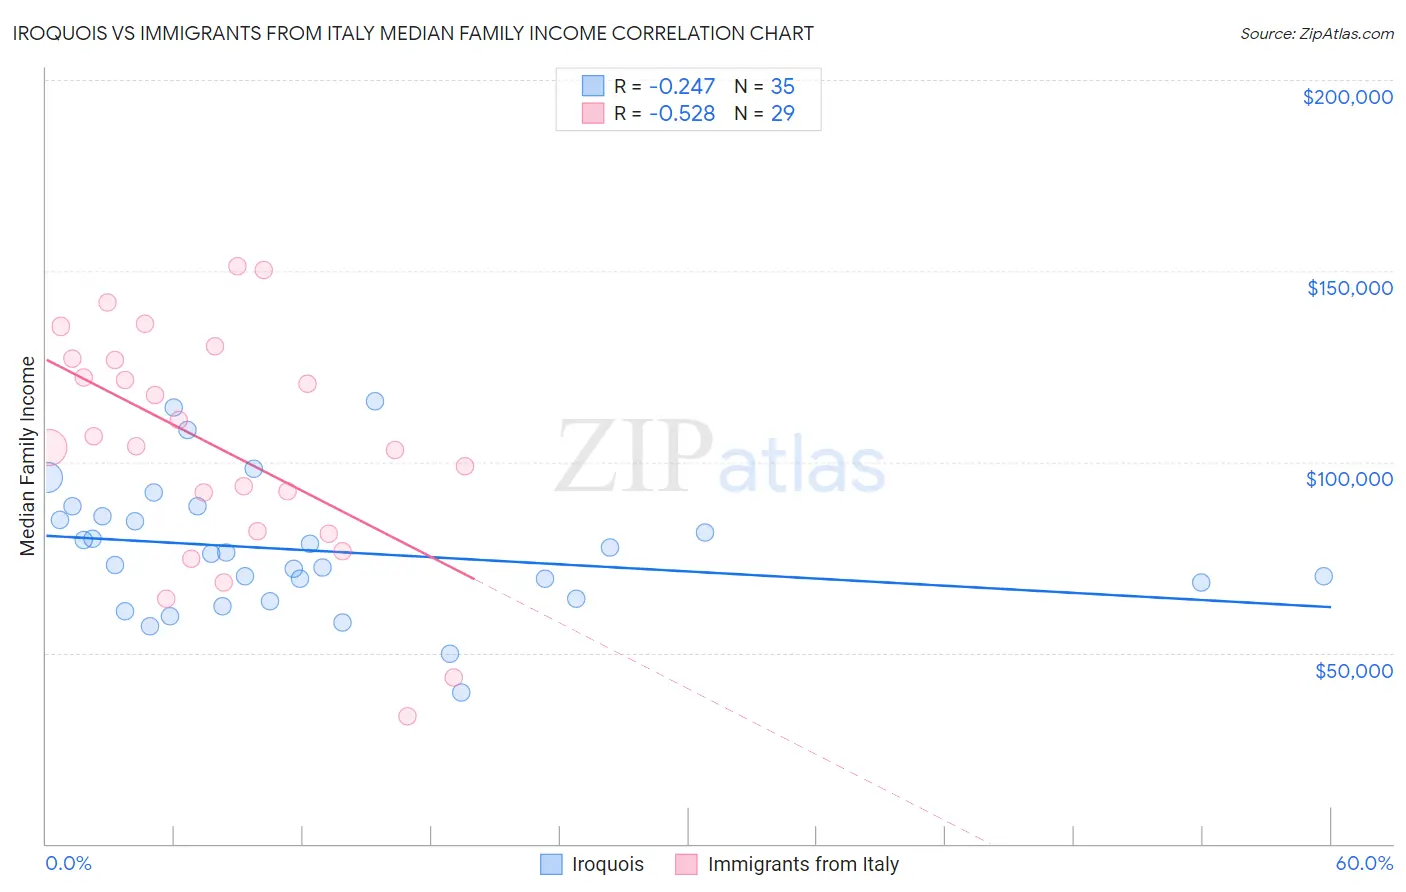
Iroquois vs Immigrants from Italy Median Family Income Correlation Chart
The statistical analysis conducted on geographies consisting of 207,203,022 people shows a weak negative correlation between the proportion of Iroquois and median family income in the United States with a correlation coefficient (R) of -0.247 and weighted average of $90,543. Similarly, the statistical analysis conducted on geographies consisting of 324,100,619 people shows a substantial negative correlation between the proportion of Immigrants from Italy and median family income in the United States with a correlation coefficient (R) of -0.528 and weighted average of $112,848, a difference of 24.6%.
Median Family Income Correlation Summary
| Measurement | Iroquois | Immigrants from Italy |
| Minimum | $39,479 | $33,393 |
| Maximum | $115,891 | $151,250 |
| Range | $76,412 | $117,857 |
| Mean | $76,689 | $103,776 |
| Median | $75,795 | $104,131 |
| Interquartile 25% (IQ1) | $64,141 | $81,528 |
| Interquartile 75% (IQ3) | $85,646 | $126,861 |
| Interquartile Range (IQR) | $21,505 | $45,333 |
| Standard Deviation (Sample) | $16,973 | $30,032 |
| Standard Deviation (Population) | $16,729 | $29,509 |
Similar Demographics by Median Family Income
Demographics Similar to Iroquois by Median Family Income
In terms of median family income, the demographic groups most similar to Iroquois are Jamaican ($90,581, a difference of 0.040%), Immigrants from Liberia ($90,450, a difference of 0.10%), Immigrants from Micronesia ($90,345, a difference of 0.22%), Spanish American ($90,322, a difference of 0.24%), and Cree ($90,882, a difference of 0.37%).
| Demographics | Rating | Rank | Median Family Income |
| Senegalese | 0.3 /100 | #264 | Tragic $91,475 |
| Hmong | 0.3 /100 | #265 | Tragic $91,296 |
| Central Americans | 0.3 /100 | #266 | Tragic $91,087 |
| Mexican American Indians | 0.2 /100 | #267 | Tragic $90,918 |
| Cree | 0.2 /100 | #268 | Tragic $90,882 |
| Belizeans | 0.2 /100 | #269 | Tragic $90,880 |
| Jamaicans | 0.2 /100 | #270 | Tragic $90,581 |
| Iroquois | 0.2 /100 | #271 | Tragic $90,543 |
| Immigrants | Liberia | 0.2 /100 | #272 | Tragic $90,450 |
| Immigrants | Micronesia | 0.2 /100 | #273 | Tragic $90,345 |
| Spanish Americans | 0.2 /100 | #274 | Tragic $90,322 |
| Immigrants | St. Vincent and the Grenadines | 0.2 /100 | #275 | Tragic $90,094 |
| Immigrants | Zaire | 0.1 /100 | #276 | Tragic $89,285 |
| Immigrants | Jamaica | 0.1 /100 | #277 | Tragic $89,268 |
| Immigrants | Grenada | 0.1 /100 | #278 | Tragic $89,249 |
Demographics Similar to Immigrants from Italy by Median Family Income
In terms of median family income, the demographic groups most similar to Immigrants from Italy are Laotian ($112,859, a difference of 0.010%), Afghan ($112,971, a difference of 0.11%), Immigrants from Western Europe ($112,688, a difference of 0.14%), Argentinean ($112,665, a difference of 0.16%), and Immigrants from Eastern Europe ($112,527, a difference of 0.29%).
| Demographics | Rating | Rank | Median Family Income |
| Immigrants | Spain | 99.7 /100 | #67 | Exceptional $113,815 |
| Immigrants | Serbia | 99.6 /100 | #68 | Exceptional $113,463 |
| Immigrants | Bulgaria | 99.6 /100 | #69 | Exceptional $113,461 |
| Immigrants | Romania | 99.6 /100 | #70 | Exceptional $113,434 |
| South Africans | 99.5 /100 | #71 | Exceptional $113,229 |
| Afghans | 99.5 /100 | #72 | Exceptional $112,971 |
| Laotians | 99.5 /100 | #73 | Exceptional $112,859 |
| Immigrants | Italy | 99.4 /100 | #74 | Exceptional $112,848 |
| Immigrants | Western Europe | 99.4 /100 | #75 | Exceptional $112,688 |
| Argentineans | 99.4 /100 | #76 | Exceptional $112,665 |
| Immigrants | Eastern Europe | 99.4 /100 | #77 | Exceptional $112,527 |
| Immigrants | Canada | 99.3 /100 | #78 | Exceptional $112,374 |
| Italians | 99.3 /100 | #79 | Exceptional $112,372 |
| Immigrants | Croatia | 99.3 /100 | #80 | Exceptional $112,323 |
| Immigrants | North America | 99.2 /100 | #81 | Exceptional $112,151 |