Cuban vs Immigrants from Italy 1st Grade

COMPARE

Cuban
Race
Ancestry
AfghanAfricanAlaska NativeAlaskan AthabascanAlbanianAleutAlsatianAmericanApacheArabArapahoArgentineanArmenianAssyrian/Chaldean/SyriacAustralianAustrianBahamianBangladeshiBarbadianBasqueBelgianBelizeanBermudanBhutaneseBlackfeetBolivianBrazilianBritishBritish West IndianBulgarianBurmeseCajunCambodianCanadianCape VerdeanCarpatho RusynCelticCentral AmericanCentral American IndianCherokeeCheyenneChickasawChileanChineseChippewaChoctawColombianColvilleComancheCosta RicanCreeCreekCroatianCrowCubanCypriotCzechCzechoslovakianDanishDelawareDominicanDutchDutch West IndianEastern EuropeanEcuadorianEgyptianEnglishEstonianEthiopianEuropeanFijianFilipinoFinnishFrenchFrench American IndianFrench CanadianGermanGerman RussianGhanaianGreekGuamanian/ChamorroGuatemalanGuyaneseHaitianHmongHonduranHopiHoumaHungarianIcelanderIndian (Asian)IndonesianInupiatIranianIraqiIrishIroquoisIsraeliItalianJamaicanJapaneseJordanianKenyanKiowaKoreanLaotianLatvianLebaneseLiberianLithuanianLumbeeLuxembourgerMacedonianMalaysianMalteseMarshalleseMenomineeMexicanMexican American IndianMongolianMoroccanNative HawaiianNavajoNepaleseNew ZealanderNicaraguanNigerianNorthern EuropeanNorwegianOkinawanOsageOttawaPaiutePakistaniPalestinianPanamanianParaguayanPennsylvania GermanPeruvianPimaPolishPortuguesePotawatomiPuebloPuerto RicanPuget Sound SalishRomanianRussianSalvadoranSamoanScandinavianScotch-IrishScottishSeminoleSenegaleseSerbianShoshoneSierra LeoneanSiouxSlavicSlovakSloveneSomaliSouth AfricanSouth AmericanSouth American IndianSoviet UnionSpaniardSpanishSpanish AmericanSpanish American IndianSri LankanSubsaharan AfricanSudaneseSwedishSwissSyrianTaiwaneseThaiTlingit-HaidaTohono O'OdhamTonganTrinidadian and TobagonianTsimshianTurkishU.S. Virgin IslanderUgandanUkrainianUruguayanUteVenezuelanVietnameseWelshWest IndianYakamaYaquiYugoslavianYumanYup'ikZimbabwean
Immigration
NonimmigrantsImmigrantsAfghanistanAfricaAlbaniaArgentinaArmeniaAsiaAustraliaAustriaBahamasBangladeshBarbadosBelarusBelgiumBelizeBoliviaBosnia and HerzegovinaBrazilBulgariaBurma/MyanmarCabo VerdeCambodiaCameroonCanadaCaribbeanCentral AmericaChileChinaColombiaCongoCosta RicaCroatiaCubaCzechoslovakiaDenmarkDominicaDominican RepublicEastern AfricaEastern AsiaEastern EuropeEcuadorEgyptEl SalvadorEnglandEritreaEthiopiaEuropeFijiFranceGermanyGhanaGreeceGrenadaGuatemalaGuyanaHaitiHondurasHong KongHungaryIndiaIndonesiaIranIraqIrelandIsraelJamaicaJapanJordanKazakhstanKenyaKoreaKuwaitLaosLatin AmericaLatviaLebanonLiberiaLithuaniaMalaysiaMexicoMicronesiaMiddle AfricaMoldovaMoroccoNepalNetherlandsNicaraguaNigeriaNorth AmericaNorth MacedoniaNorthern AfricaNorthern EuropeNorwayOceaniaPakistanPanamaPeruPhilippinesPolandPortugalRomaniaRussiaSaudi ArabiaScotlandSenegalSerbiaSierra LeoneSingaporeSomaliaSouth AfricaSouth AmericaSouth Central AsiaSouth Eastern AsiaSouthern EuropeSpainSri LankaSt. Vincent and the GrenadinesSudanSwedenSwitzerlandSyriaTaiwanThailandTrinidad and TobagoTurkeyUgandaUkraineUruguayUzbekistanVenezuelaVietnamWest IndiesWestern AfricaWestern AsiaWestern EuropeYemenZaireZimbabweAzores
Immigrants from Italy
Race
Ancestry
AfghanAfricanAlaska NativeAlaskan AthabascanAlbanianAleutAlsatianAmericanApacheArabArapahoArgentineanArmenianAssyrian/Chaldean/SyriacAustralianAustrianBahamianBangladeshiBarbadianBasqueBelgianBelizeanBermudanBhutaneseBlackfeetBolivianBrazilianBritishBritish West IndianBulgarianBurmeseCajunCambodianCanadianCape VerdeanCarpatho RusynCelticCentral AmericanCentral American IndianCherokeeCheyenneChickasawChileanChineseChippewaChoctawColombianColvilleComancheCosta RicanCreeCreekCroatianCrowCypriotCzechCzechoslovakianDanishDelawareDominicanDutchDutch West IndianEastern EuropeanEcuadorianEgyptianEnglishEstonianEthiopianEuropeanFijianFilipinoFinnishFrenchFrench American IndianFrench CanadianGermanGerman RussianGhanaianGreekGuamanian/ChamorroGuatemalanGuyaneseHaitianHmongHonduranHopiHoumaHungarianIcelanderIndian (Asian)IndonesianInupiatIranianIraqiIrishIroquoisIsraeliItalianJamaicanJapaneseJordanianKenyanKiowaKoreanLaotianLatvianLebaneseLiberianLithuanianLumbeeLuxembourgerMacedonianMalaysianMalteseMarshalleseMenomineeMexicanMexican American IndianMongolianMoroccanNative HawaiianNavajoNepaleseNew ZealanderNicaraguanNigerianNorthern EuropeanNorwegianOkinawanOsageOttawaPaiutePakistaniPalestinianPanamanianParaguayanPennsylvania GermanPeruvianPimaPolishPortuguesePotawatomiPuebloPuerto RicanPuget Sound SalishRomanianRussianSalvadoranSamoanScandinavianScotch-IrishScottishSeminoleSenegaleseSerbianShoshoneSierra LeoneanSiouxSlavicSlovakSloveneSomaliSouth AfricanSouth AmericanSouth American IndianSoviet UnionSpaniardSpanishSpanish AmericanSpanish American IndianSri LankanSubsaharan AfricanSudaneseSwedishSwissSyrianTaiwaneseThaiTlingit-HaidaTohono O'OdhamTonganTrinidadian and TobagonianTsimshianTurkishU.S. Virgin IslanderUgandanUkrainianUruguayanUteVenezuelanVietnameseWelshWest IndianYakamaYaquiYugoslavianYumanYup'ikZimbabwean
Immigration
NonimmigrantsImmigrantsAfghanistanAfricaAlbaniaArgentinaArmeniaAsiaAustraliaAustriaBahamasBangladeshBarbadosBelarusBelgiumBelizeBoliviaBosnia and HerzegovinaBrazilBulgariaBurma/MyanmarCabo VerdeCambodiaCameroonCanadaCaribbeanCentral AmericaChileChinaColombiaCongoCosta RicaCroatiaCubaCzechoslovakiaDenmarkDominicaDominican RepublicEastern AfricaEastern AsiaEastern EuropeEcuadorEgyptEl SalvadorEnglandEritreaEthiopiaEuropeFijiFranceGermanyGhanaGreeceGrenadaGuatemalaGuyanaHaitiHondurasHong KongHungaryIndiaIndonesiaIranIraqIrelandIsraelItalyJamaicaJapanJordanKazakhstanKenyaKoreaKuwaitLaosLatin AmericaLatviaLebanonLiberiaLithuaniaMalaysiaMexicoMicronesiaMiddle AfricaMoldovaMoroccoNepalNetherlandsNicaraguaNigeriaNorth AmericaNorth MacedoniaNorthern AfricaNorthern EuropeNorwayOceaniaPakistanPanamaPeruPhilippinesPolandPortugalRomaniaRussiaSaudi ArabiaScotlandSenegalSerbiaSierra LeoneSingaporeSomaliaSouth AfricaSouth AmericaSouth Central AsiaSouth Eastern AsiaSouthern EuropeSpainSri LankaSt. Vincent and the GrenadinesSudanSwedenSwitzerlandSyriaTaiwanThailandTrinidad and TobagoTurkeyUgandaUkraineUruguayUzbekistanVenezuelaVietnamWest IndiesWestern AfricaWestern AsiaWestern EuropeYemenZaireZimbabweAzores
1st Grade
Income
Poverty
Unemployment
Labor Participation
Family Structure
Vehicle Availability
Education Level
Disability

1st Grade Comparison

Cubans

Immigrants from Italy

Tragic
Average
97.5%
1ST GRADE
0.3/ 100
METRIC RATING
265th/ 347
METRIC RANK
97.9%
1ST GRADE
59.1/ 100
METRIC RATING
161st/ 347
METRIC RANK

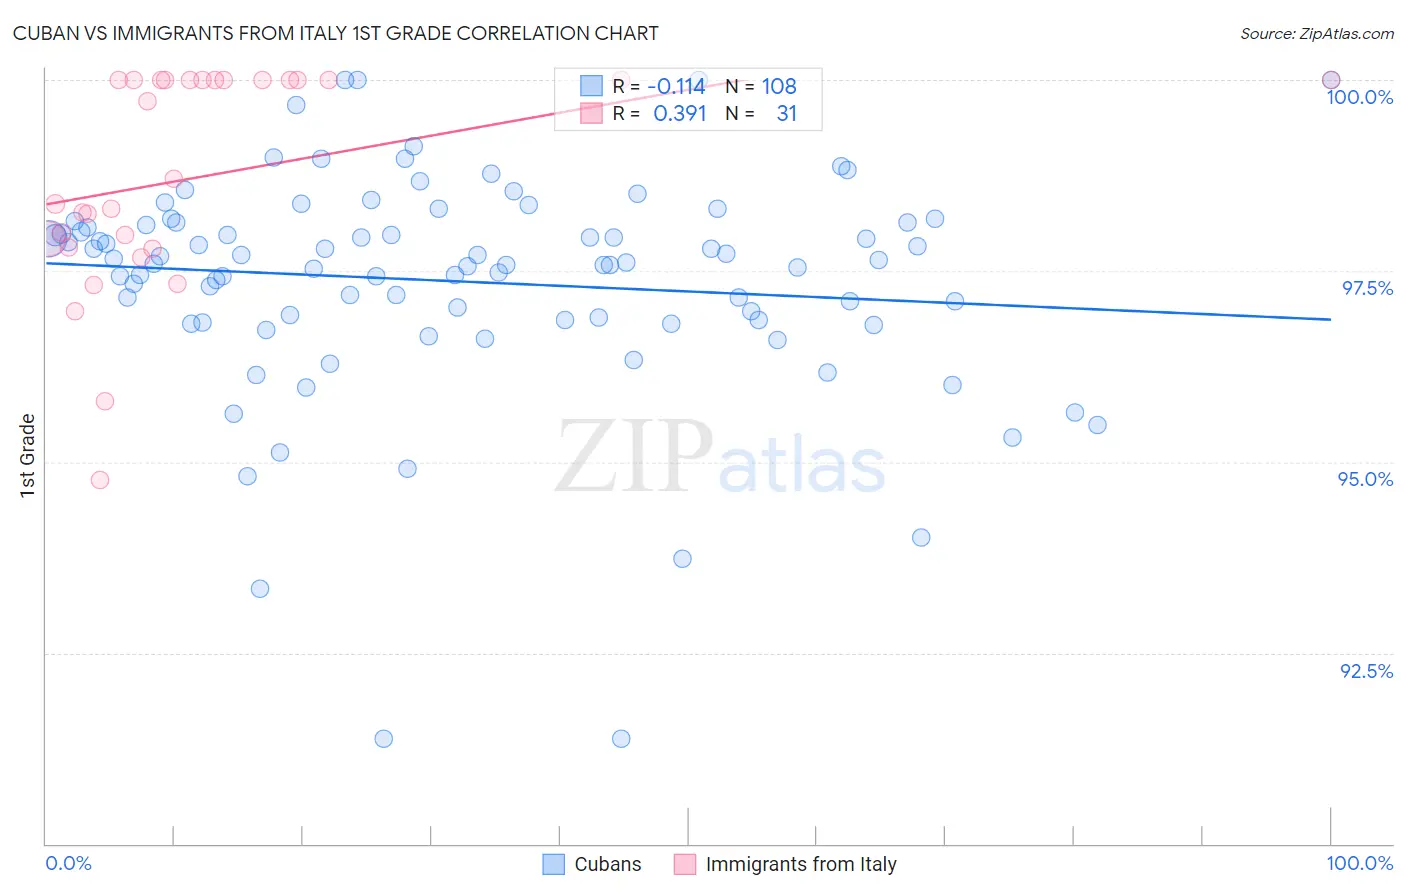
Cuban vs Immigrants from Italy 1st Grade Correlation Chart

The statistical analysis conducted on geographies consisting of 449,326,865 people shows a poor negative correlation between the proportion of Cubans and percentage of population with at least 1st grade education in the United States with a correlation coefficient (R) of -0.114 and weighted average of 97.5%. Similarly, the statistical analysis conducted on geographies consisting of 324,225,917 people shows a mild positive correlation between the proportion of Immigrants from Italy and percentage of population with at least 1st grade education in the United States with a correlation coefficient (R) of 0.391 and weighted average of 97.9%, a difference of 0.47%.
Cuban vs Immigrants from Italy 1st Grade

1st Grade Correlation Summary

MeasurementCubanImmigrants from Italy
Minimum91.4%94.8%
Maximum100.0%100.0%
Range8.6%5.2%
Mean97.4%98.7%
Median97.6%98.7%
Interquartile 25% (IQ1)96.9%97.8%
Interquartile 75% (IQ3)98.1%100.0%
Interquartile Range (IQR)1.3%2.2%
Standard Deviation (Sample)1.5%1.4%
Standard Deviation (Population)1.5%1.4%

Similar Demographics by 1st Grade

Demographics Similar to Cubans by 1st Grade

In terms of 1st grade, the demographic groups most similar to Cubans are Immigrants from Liberia (97.5%, a difference of 0.0%), Immigrants from Sierra Leone (97.5%, a difference of 0.0%), Immigrants from South America (97.5%, a difference of 0.010%), Taiwanese (97.5%, a difference of 0.010%), and Immigrants from Nigeria (97.5%, a difference of 0.010%).
DemographicsRating | Rank1st Grade
Indians (Asian)
0.6
/100
|
#258
Tragic
97.5%
Fijians
0.5
/100
|
#259
Tragic
97.5%
Armenians
0.5
/100
|
#260
Tragic
97.5%
Immigrants | Ethiopia
0.4
/100
|
#261
Tragic
97.5%
Assyrians/Chaldeans/Syriacs
0.4
/100
|
#262
Tragic
97.5%
Immigrants | South America
0.4
/100
|
#263
Tragic
97.5%
Taiwanese
0.4
/100
|
#264
Tragic
97.5%
Cubans
0.3
/100
|
#265
Tragic
97.5%
Immigrants | Liberia
0.3
/100
|
#266
Tragic
97.5%
Immigrants | Sierra Leone
0.3
/100
|
#267
Tragic
97.5%
Immigrants | Nigeria
0.3
/100
|
#268
Tragic
97.5%
West Indians
0.3
/100
|
#269
Tragic
97.5%
Immigrants | Jamaica
0.2
/100
|
#270
Tragic
97.5%
Immigrants | Cameroon
0.2
/100
|
#271
Tragic
97.4%
Immigrants | Peru
0.2
/100
|
#272
Tragic
97.4%

Demographics Similar to Immigrants from Italy by 1st Grade

In terms of 1st grade, the demographic groups most similar to Immigrants from Italy are Immigrants from Russia (97.9%, a difference of 0.0%), Immigrants from Eastern Europe (97.9%, a difference of 0.0%), Spanish American (97.9%, a difference of 0.0%), Brazilian (97.9%, a difference of 0.0%), and Ugandan (97.9%, a difference of 0.010%).
DemographicsRating | Rank1st Grade
Immigrants | Iran
66.9
/100
|
#154
Good
98.0%
Comanche
66.9
/100
|
#155
Good
98.0%
Immigrants | South Central Asia
66.2
/100
|
#156
Good
98.0%
Immigrants | North Macedonia
65.3
/100
|
#157
Good
98.0%
Venezuelans
64.7
/100
|
#158
Good
98.0%
French American Indians
63.7
/100
|
#159
Good
98.0%
Immigrants | Russia
59.2
/100
|
#160
Average
97.9%
Immigrants | Italy
59.1
/100
|
#161
Average
97.9%
Immigrants | Eastern Europe
58.9
/100
|
#162
Average
97.9%
Spanish Americans
57.7
/100
|
#163
Average
97.9%
Brazilians
57.6
/100
|
#164
Average
97.9%
Ugandans
56.9
/100
|
#165
Average
97.9%
Navajo
56.6
/100
|
#166
Average
97.9%
Bermudans
56.3
/100
|
#167
Average
97.9%
Chileans
55.6
/100
|
#168
Average
97.9%