White/Caucasian vs Immigrants from Italy Median Family Income
COMPARE
White/Caucasian
Immigrants from Italy
Median Family Income
Median Family Income Comparison
Whites/Caucasians
Immigrants from Italy
$99,800
MEDIAN FAMILY INCOME
18.7/ 100
METRIC RATING
202nd/ 347
METRIC RANK
$112,848
MEDIAN FAMILY INCOME
99.4/ 100
METRIC RATING
74th/ 347
METRIC RANK
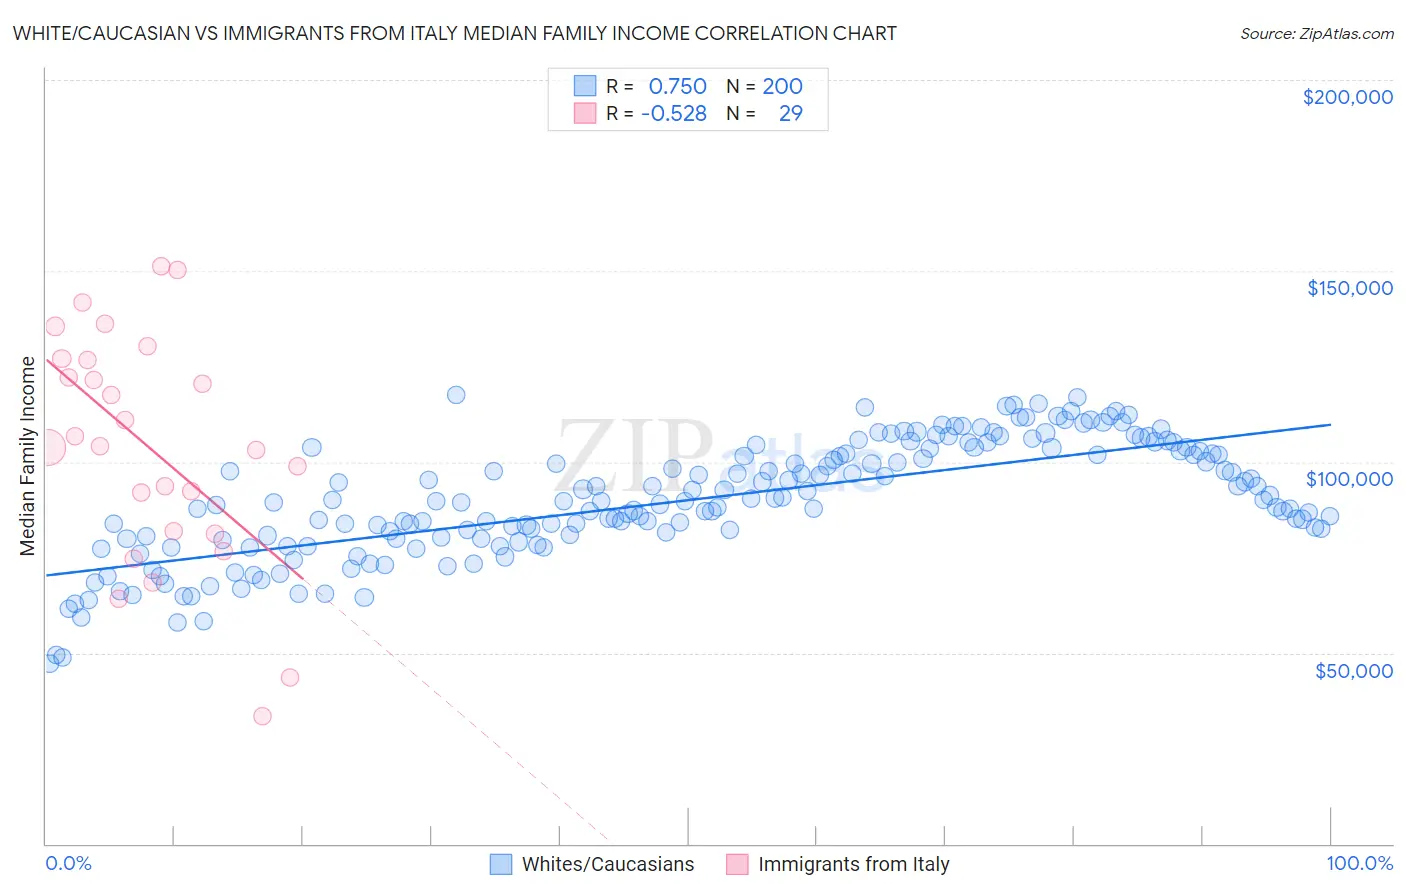
White/Caucasian vs Immigrants from Italy Median Family Income Correlation Chart
The statistical analysis conducted on geographies consisting of 582,814,142 people shows a strong positive correlation between the proportion of Whites/Caucasians and median family income in the United States with a correlation coefficient (R) of 0.750 and weighted average of $99,800. Similarly, the statistical analysis conducted on geographies consisting of 324,100,619 people shows a substantial negative correlation between the proportion of Immigrants from Italy and median family income in the United States with a correlation coefficient (R) of -0.528 and weighted average of $112,848, a difference of 13.1%.
Median Family Income Correlation Summary
| Measurement | White/Caucasian | Immigrants from Italy |
| Minimum | $47,087 | $33,393 |
| Maximum | $117,539 | $151,250 |
| Range | $70,452 | $117,857 |
| Mean | $89,997 | $103,776 |
| Median | $89,813 | $104,131 |
| Interquartile 25% (IQ1) | $80,036 | $81,528 |
| Interquartile 75% (IQ3) | $102,904 | $126,861 |
| Interquartile Range (IQR) | $22,868 | $45,333 |
| Standard Deviation (Sample) | $15,237 | $30,032 |
| Standard Deviation (Population) | $15,199 | $29,509 |
Similar Demographics by Median Family Income
Demographics Similar to Whites/Caucasians by Median Family Income
In terms of median family income, the demographic groups most similar to Whites/Caucasians are Immigrants from Thailand ($99,840, a difference of 0.040%), Spanish ($99,977, a difference of 0.18%), Scotch-Irish ($99,591, a difference of 0.21%), Yugoslavian ($100,119, a difference of 0.32%), and Immigrants from Africa ($100,256, a difference of 0.46%).
| Demographics | Rating | Rank | Median Family Income |
| Immigrants | South America | 23.9 /100 | #195 | Fair $100,414 |
| Samoans | 23.3 /100 | #196 | Fair $100,344 |
| Immigrants | Cameroon | 22.8 /100 | #197 | Fair $100,289 |
| Immigrants | Africa | 22.5 /100 | #198 | Fair $100,256 |
| Yugoslavians | 21.3 /100 | #199 | Fair $100,119 |
| Spanish | 20.1 /100 | #200 | Fair $99,977 |
| Immigrants | Thailand | 19.0 /100 | #201 | Poor $99,840 |
| Whites/Caucasians | 18.7 /100 | #202 | Poor $99,800 |
| Scotch-Irish | 17.1 /100 | #203 | Poor $99,591 |
| Ghanaians | 12.6 /100 | #204 | Poor $98,877 |
| Hawaiians | 12.5 /100 | #205 | Poor $98,869 |
| Immigrants | Iraq | 12.1 /100 | #206 | Poor $98,786 |
| Aleuts | 11.6 /100 | #207 | Poor $98,702 |
| Immigrants | Uruguay | 9.2 /100 | #208 | Tragic $98,205 |
| Immigrants | Colombia | 8.7 /100 | #209 | Tragic $98,067 |
Demographics Similar to Immigrants from Italy by Median Family Income
In terms of median family income, the demographic groups most similar to Immigrants from Italy are Laotian ($112,859, a difference of 0.010%), Afghan ($112,971, a difference of 0.11%), Immigrants from Western Europe ($112,688, a difference of 0.14%), Argentinean ($112,665, a difference of 0.16%), and Immigrants from Eastern Europe ($112,527, a difference of 0.29%).
| Demographics | Rating | Rank | Median Family Income |
| Immigrants | Spain | 99.7 /100 | #67 | Exceptional $113,815 |
| Immigrants | Serbia | 99.6 /100 | #68 | Exceptional $113,463 |
| Immigrants | Bulgaria | 99.6 /100 | #69 | Exceptional $113,461 |
| Immigrants | Romania | 99.6 /100 | #70 | Exceptional $113,434 |
| South Africans | 99.5 /100 | #71 | Exceptional $113,229 |
| Afghans | 99.5 /100 | #72 | Exceptional $112,971 |
| Laotians | 99.5 /100 | #73 | Exceptional $112,859 |
| Immigrants | Italy | 99.4 /100 | #74 | Exceptional $112,848 |
| Immigrants | Western Europe | 99.4 /100 | #75 | Exceptional $112,688 |
| Argentineans | 99.4 /100 | #76 | Exceptional $112,665 |
| Immigrants | Eastern Europe | 99.4 /100 | #77 | Exceptional $112,527 |
| Immigrants | Canada | 99.3 /100 | #78 | Exceptional $112,374 |
| Italians | 99.3 /100 | #79 | Exceptional $112,372 |
| Immigrants | Croatia | 99.3 /100 | #80 | Exceptional $112,323 |
| Immigrants | North America | 99.2 /100 | #81 | Exceptional $112,151 |