Immigrants from Latin America vs Carpatho Rusyn Median Family Income
COMPARE
Immigrants from Latin America
Carpatho Rusyn
Median Family Income
Median Family Income Comparison
Immigrants from Latin America
Carpatho Rusyns
$86,989
MEDIAN FAMILY INCOME
0.0/ 100
METRIC RATING
298th/ 347
METRIC RANK
$107,502
MEDIAN FAMILY INCOME
92.2/ 100
METRIC RATING
123rd/ 347
METRIC RANK
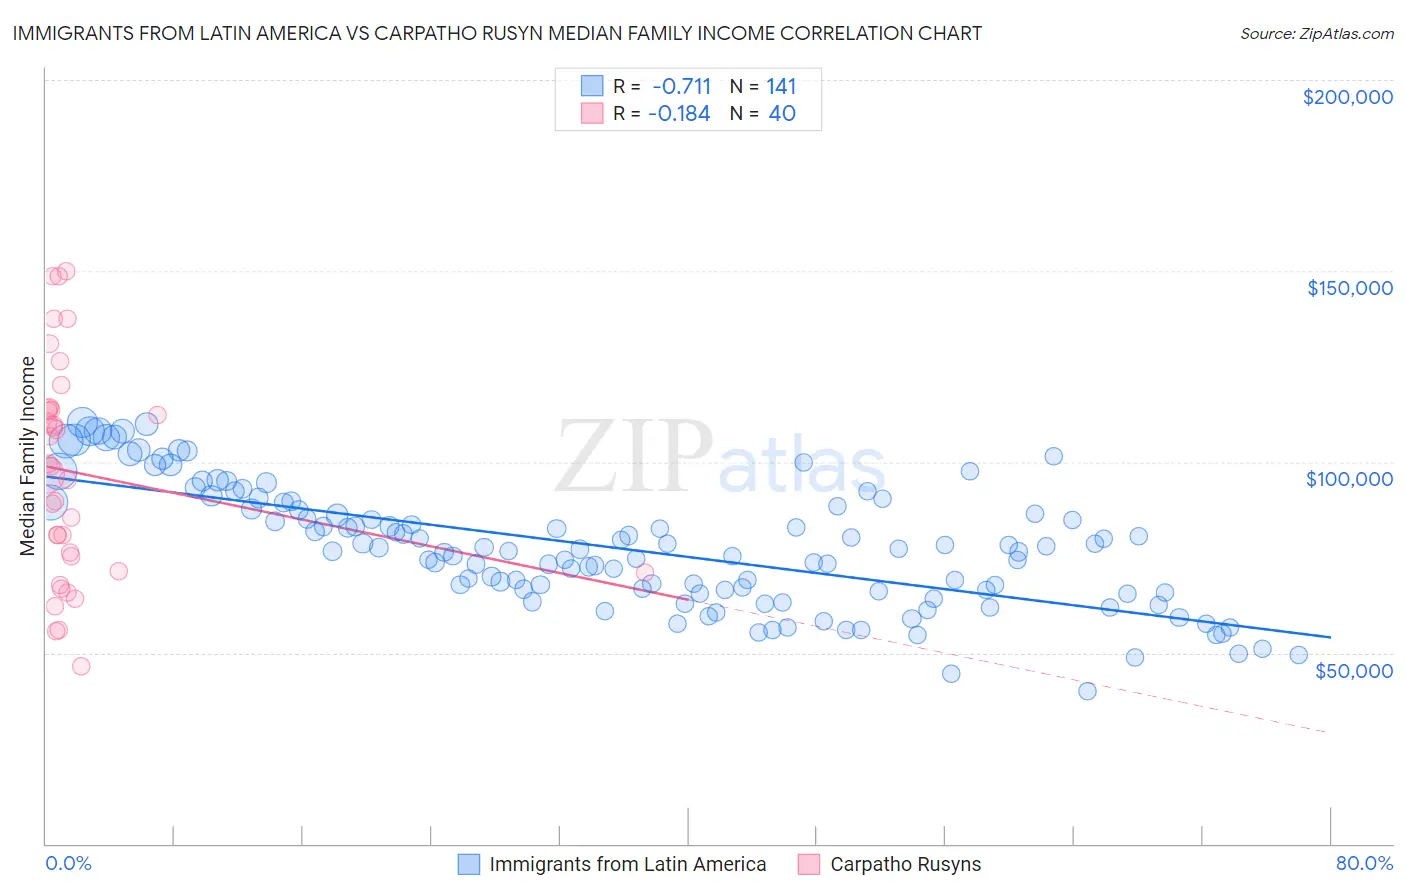
Immigrants from Latin America vs Carpatho Rusyn Median Family Income Correlation Chart
The statistical analysis conducted on geographies consisting of 557,337,898 people shows a strong negative correlation between the proportion of Immigrants from Latin America and median family income in the United States with a correlation coefficient (R) of -0.711 and weighted average of $86,989. Similarly, the statistical analysis conducted on geographies consisting of 58,866,021 people shows a poor negative correlation between the proportion of Carpatho Rusyns and median family income in the United States with a correlation coefficient (R) of -0.184 and weighted average of $107,502, a difference of 23.6%.
Median Family Income Correlation Summary
| Measurement | Immigrants from Latin America | Carpatho Rusyn |
| Minimum | $39,785 | $46,375 |
| Maximum | $110,302 | $150,052 |
| Range | $70,517 | $103,677 |
| Mean | $77,259 | $97,160 |
| Median | $76,749 | $97,813 |
| Interquartile 25% (IQ1) | $66,005 | $73,203 |
| Interquartile 75% (IQ3) | $88,129 | $113,650 |
| Interquartile Range (IQR) | $22,124 | $40,447 |
| Standard Deviation (Sample) | $15,813 | $27,905 |
| Standard Deviation (Population) | $15,756 | $27,554 |
Similar Demographics by Median Family Income
Demographics Similar to Immigrants from Latin America by Median Family Income
In terms of median family income, the demographic groups most similar to Immigrants from Latin America are Chippewa ($86,852, a difference of 0.16%), Cajun ($87,157, a difference of 0.19%), Immigrants from Guatemala ($87,191, a difference of 0.23%), Yaqui ($87,289, a difference of 0.34%), and Fijian ($87,387, a difference of 0.46%).
| Demographics | Rating | Rank | Median Family Income |
| Immigrants | Cabo Verde | 0.1 /100 | #291 | Tragic $87,830 |
| Africans | 0.1 /100 | #292 | Tragic $87,820 |
| Ute | 0.0 /100 | #293 | Tragic $87,596 |
| Fijians | 0.0 /100 | #294 | Tragic $87,387 |
| Yaqui | 0.0 /100 | #295 | Tragic $87,289 |
| Immigrants | Guatemala | 0.0 /100 | #296 | Tragic $87,191 |
| Cajuns | 0.0 /100 | #297 | Tragic $87,157 |
| Immigrants | Latin America | 0.0 /100 | #298 | Tragic $86,989 |
| Chippewa | 0.0 /100 | #299 | Tragic $86,852 |
| Ottawa | 0.0 /100 | #300 | Tragic $86,380 |
| Colville | 0.0 /100 | #301 | Tragic $85,792 |
| Spanish American Indians | 0.0 /100 | #302 | Tragic $85,728 |
| Hispanics or Latinos | 0.0 /100 | #303 | Tragic $85,647 |
| Mexicans | 0.0 /100 | #304 | Tragic $85,618 |
| Paiute | 0.0 /100 | #305 | Tragic $85,414 |
Demographics Similar to Carpatho Rusyns by Median Family Income
In terms of median family income, the demographic groups most similar to Carpatho Rusyns are Pakistani ($107,390, a difference of 0.11%), Taiwanese ($107,295, a difference of 0.19%), Immigrants from Jordan ($107,715, a difference of 0.20%), Serbian ($107,157, a difference of 0.32%), and Lebanese ($107,086, a difference of 0.39%).
| Demographics | Rating | Rank | Median Family Income |
| Chileans | 95.0 /100 | #116 | Exceptional $108,429 |
| Immigrants | Philippines | 94.6 /100 | #117 | Exceptional $108,288 |
| Ethiopians | 94.5 /100 | #118 | Exceptional $108,251 |
| Sri Lankans | 94.5 /100 | #119 | Exceptional $108,234 |
| Immigrants | Northern Africa | 94.3 /100 | #120 | Exceptional $108,161 |
| Europeans | 94.1 /100 | #121 | Exceptional $108,099 |
| Immigrants | Jordan | 92.9 /100 | #122 | Exceptional $107,715 |
| Carpatho Rusyns | 92.2 /100 | #123 | Exceptional $107,502 |
| Pakistanis | 91.7 /100 | #124 | Exceptional $107,390 |
| Taiwanese | 91.4 /100 | #125 | Exceptional $107,295 |
| Serbians | 90.8 /100 | #126 | Exceptional $107,157 |
| Lebanese | 90.5 /100 | #127 | Exceptional $107,086 |
| Immigrants | Ethiopia | 90.0 /100 | #128 | Excellent $106,969 |
| Arabs | 89.9 /100 | #129 | Excellent $106,952 |
| Brazilians | 89.8 /100 | #130 | Excellent $106,942 |