Yakama vs Carpatho Rusyn Median Family Income
COMPARE
Yakama
Carpatho Rusyn
Median Family Income
Median Family Income Comparison
Yakama
Carpatho Rusyns
$83,932
MEDIAN FAMILY INCOME
0.0/ 100
METRIC RATING
317th/ 347
METRIC RANK
$107,502
MEDIAN FAMILY INCOME
92.2/ 100
METRIC RATING
123rd/ 347
METRIC RANK
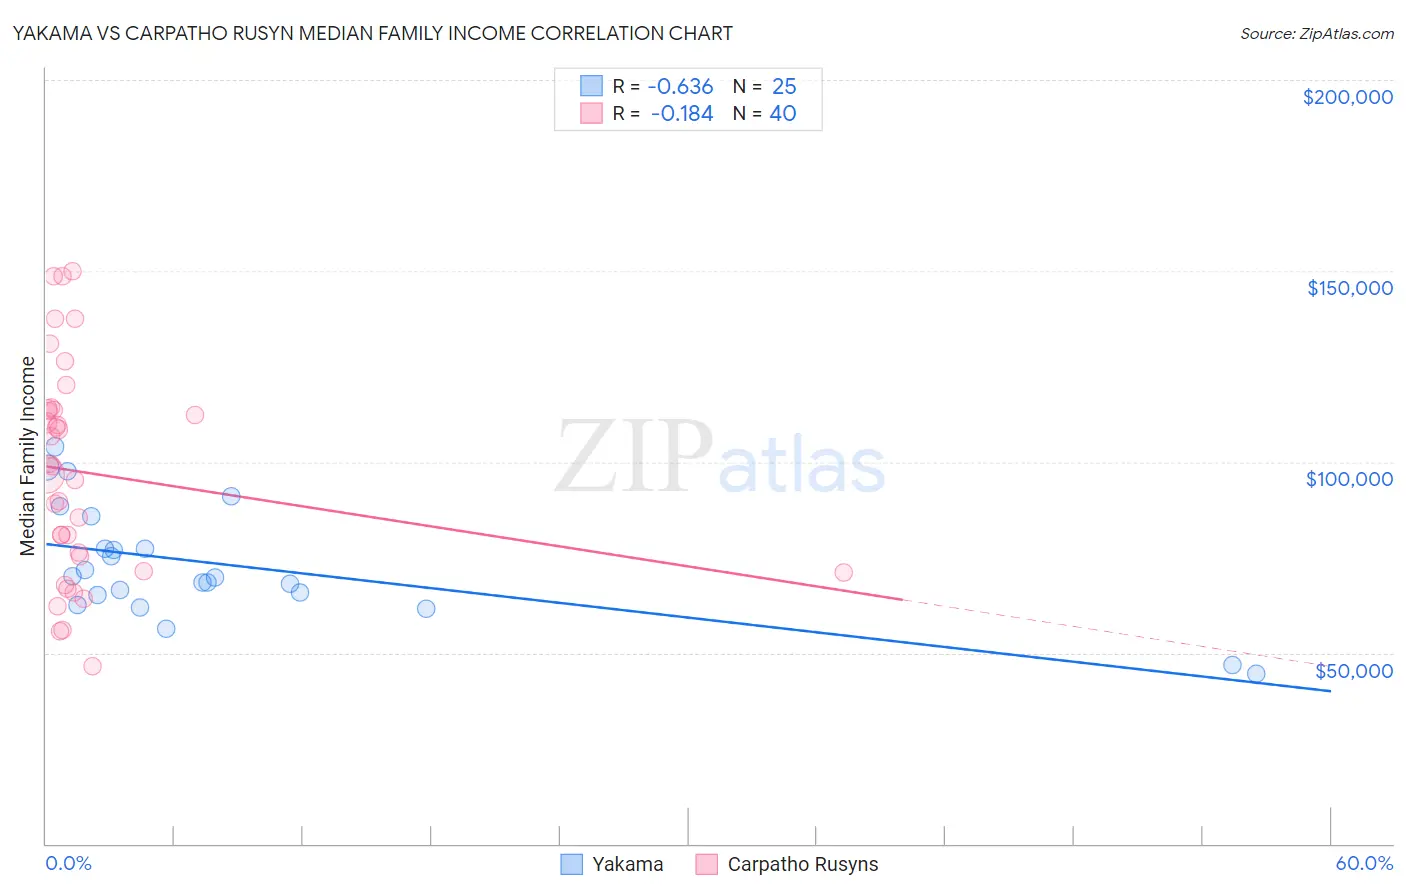
Yakama vs Carpatho Rusyn Median Family Income Correlation Chart
The statistical analysis conducted on geographies consisting of 19,915,987 people shows a significant negative correlation between the proportion of Yakama and median family income in the United States with a correlation coefficient (R) of -0.636 and weighted average of $83,932. Similarly, the statistical analysis conducted on geographies consisting of 58,866,021 people shows a poor negative correlation between the proportion of Carpatho Rusyns and median family income in the United States with a correlation coefficient (R) of -0.184 and weighted average of $107,502, a difference of 28.1%.
Median Family Income Correlation Summary
| Measurement | Yakama | Carpatho Rusyn |
| Minimum | $44,375 | $46,375 |
| Maximum | $103,973 | $150,052 |
| Range | $59,598 | $103,677 |
| Mean | $72,774 | $97,160 |
| Median | $69,699 | $97,813 |
| Interquartile 25% (IQ1) | $63,837 | $73,203 |
| Interquartile 75% (IQ3) | $81,474 | $113,650 |
| Interquartile Range (IQR) | $17,637 | $40,447 |
| Standard Deviation (Sample) | $14,936 | $27,905 |
| Standard Deviation (Population) | $14,634 | $27,554 |
Similar Demographics by Median Family Income
Demographics Similar to Yakama by Median Family Income
In terms of median family income, the demographic groups most similar to Yakama are Immigrants from Haiti ($84,018, a difference of 0.10%), Immigrants from Mexico ($83,639, a difference of 0.35%), Immigrants from Honduras ($83,618, a difference of 0.38%), Apache ($84,451, a difference of 0.62%), and Seminole ($83,354, a difference of 0.69%).
| Demographics | Rating | Rank | Median Family Income |
| Immigrants | Central America | 0.0 /100 | #310 | Tragic $85,050 |
| Hondurans | 0.0 /100 | #311 | Tragic $85,004 |
| Cubans | 0.0 /100 | #312 | Tragic $84,981 |
| Choctaw | 0.0 /100 | #313 | Tragic $84,835 |
| Immigrants | Bahamas | 0.0 /100 | #314 | Tragic $84,732 |
| Apache | 0.0 /100 | #315 | Tragic $84,451 |
| Immigrants | Haiti | 0.0 /100 | #316 | Tragic $84,018 |
| Yakama | 0.0 /100 | #317 | Tragic $83,932 |
| Immigrants | Mexico | 0.0 /100 | #318 | Tragic $83,639 |
| Immigrants | Honduras | 0.0 /100 | #319 | Tragic $83,618 |
| Seminole | 0.0 /100 | #320 | Tragic $83,354 |
| Immigrants | Caribbean | 0.0 /100 | #321 | Tragic $83,319 |
| Dominicans | 0.0 /100 | #322 | Tragic $82,888 |
| Bahamians | 0.0 /100 | #323 | Tragic $82,631 |
| Creek | 0.0 /100 | #324 | Tragic $82,560 |
Demographics Similar to Carpatho Rusyns by Median Family Income
In terms of median family income, the demographic groups most similar to Carpatho Rusyns are Pakistani ($107,390, a difference of 0.11%), Taiwanese ($107,295, a difference of 0.19%), Immigrants from Jordan ($107,715, a difference of 0.20%), Serbian ($107,157, a difference of 0.32%), and Lebanese ($107,086, a difference of 0.39%).
| Demographics | Rating | Rank | Median Family Income |
| Chileans | 95.0 /100 | #116 | Exceptional $108,429 |
| Immigrants | Philippines | 94.6 /100 | #117 | Exceptional $108,288 |
| Ethiopians | 94.5 /100 | #118 | Exceptional $108,251 |
| Sri Lankans | 94.5 /100 | #119 | Exceptional $108,234 |
| Immigrants | Northern Africa | 94.3 /100 | #120 | Exceptional $108,161 |
| Europeans | 94.1 /100 | #121 | Exceptional $108,099 |
| Immigrants | Jordan | 92.9 /100 | #122 | Exceptional $107,715 |
| Carpatho Rusyns | 92.2 /100 | #123 | Exceptional $107,502 |
| Pakistanis | 91.7 /100 | #124 | Exceptional $107,390 |
| Taiwanese | 91.4 /100 | #125 | Exceptional $107,295 |
| Serbians | 90.8 /100 | #126 | Exceptional $107,157 |
| Lebanese | 90.5 /100 | #127 | Exceptional $107,086 |
| Immigrants | Ethiopia | 90.0 /100 | #128 | Excellent $106,969 |
| Arabs | 89.9 /100 | #129 | Excellent $106,952 |
| Brazilians | 89.8 /100 | #130 | Excellent $106,942 |