Korean vs Carpatho Rusyn Median Family Income
COMPARE
Korean
Carpatho Rusyn
Median Family Income
Median Family Income Comparison
Koreans
Carpatho Rusyns
$110,103
MEDIAN FAMILY INCOME
97.8/ 100
METRIC RATING
94th/ 347
METRIC RANK
$107,502
MEDIAN FAMILY INCOME
92.2/ 100
METRIC RATING
123rd/ 347
METRIC RANK
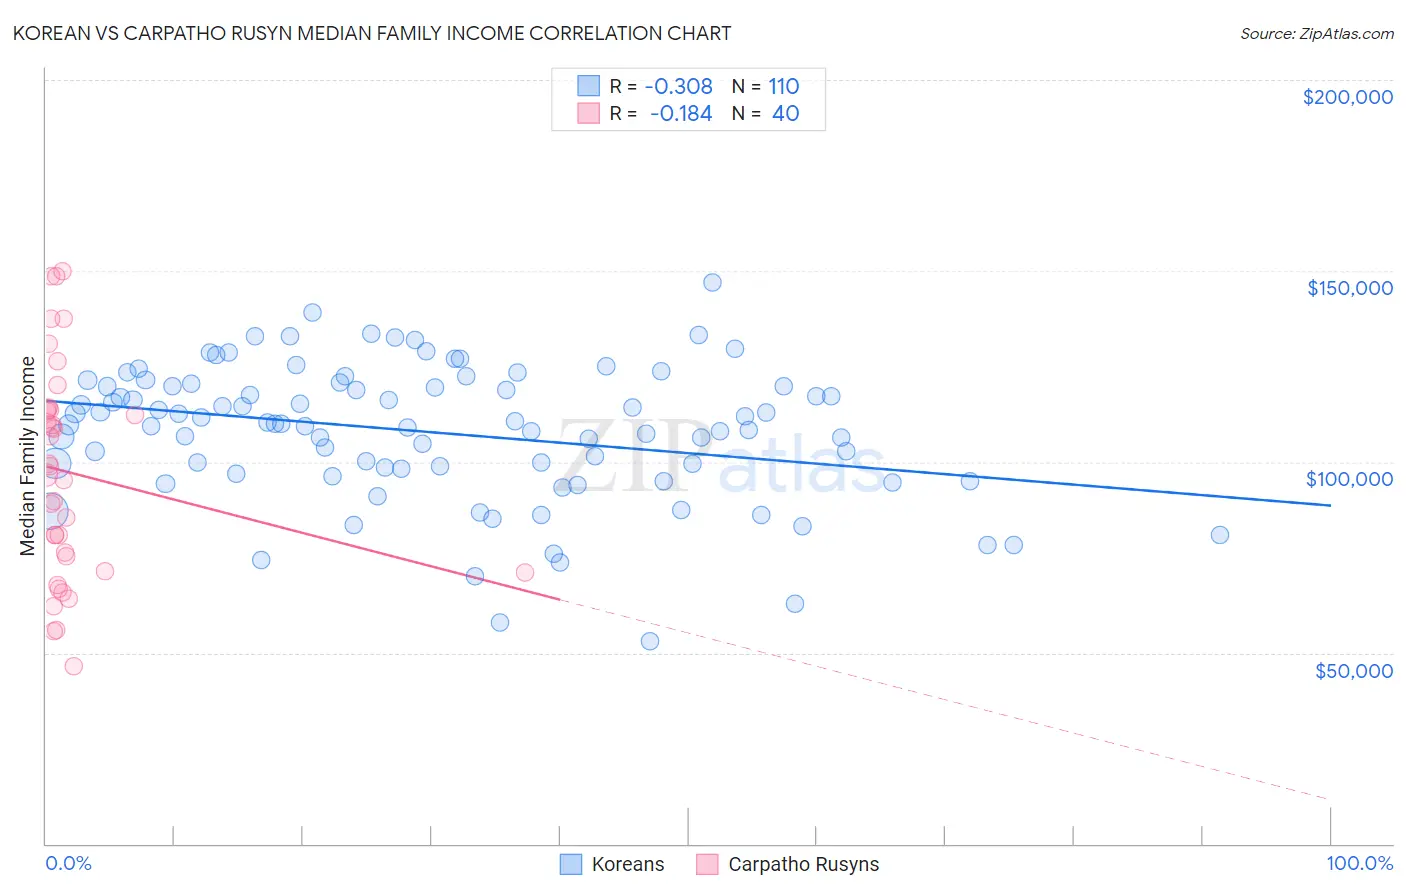
Korean vs Carpatho Rusyn Median Family Income Correlation Chart
The statistical analysis conducted on geographies consisting of 510,104,547 people shows a mild negative correlation between the proportion of Koreans and median family income in the United States with a correlation coefficient (R) of -0.308 and weighted average of $110,103. Similarly, the statistical analysis conducted on geographies consisting of 58,866,021 people shows a poor negative correlation between the proportion of Carpatho Rusyns and median family income in the United States with a correlation coefficient (R) of -0.184 and weighted average of $107,502, a difference of 2.4%.
Median Family Income Correlation Summary
| Measurement | Korean | Carpatho Rusyn |
| Minimum | $53,031 | $46,375 |
| Maximum | $146,906 | $150,052 |
| Range | $93,875 | $103,677 |
| Mean | $107,726 | $97,160 |
| Median | $109,878 | $97,813 |
| Interquartile 25% (IQ1) | $98,078 | $73,203 |
| Interquartile 75% (IQ3) | $119,779 | $113,650 |
| Interquartile Range (IQR) | $21,701 | $40,447 |
| Standard Deviation (Sample) | $17,855 | $27,905 |
| Standard Deviation (Population) | $17,774 | $27,554 |
Similar Demographics by Median Family Income
Demographics Similar to Koreans by Median Family Income
In terms of median family income, the demographic groups most similar to Koreans are Immigrants from Kazakhstan ($110,137, a difference of 0.030%), Immigrants from Lebanon ($110,159, a difference of 0.050%), Zimbabwean ($110,011, a difference of 0.080%), Immigrants from Moldova ($109,975, a difference of 0.12%), and Jordanian ($109,865, a difference of 0.22%).
| Demographics | Rating | Rank | Median Family Income |
| Austrians | 98.8 /100 | #87 | Exceptional $111,306 |
| Romanians | 98.8 /100 | #88 | Exceptional $111,243 |
| Immigrants | Argentina | 98.5 /100 | #89 | Exceptional $110,873 |
| Northern Europeans | 98.3 /100 | #90 | Exceptional $110,635 |
| Immigrants | Southern Europe | 98.3 /100 | #91 | Exceptional $110,614 |
| Immigrants | Lebanon | 97.9 /100 | #92 | Exceptional $110,159 |
| Immigrants | Kazakhstan | 97.8 /100 | #93 | Exceptional $110,137 |
| Koreans | 97.8 /100 | #94 | Exceptional $110,103 |
| Zimbabweans | 97.7 /100 | #95 | Exceptional $110,011 |
| Immigrants | Moldova | 97.7 /100 | #96 | Exceptional $109,975 |
| Jordanians | 97.5 /100 | #97 | Exceptional $109,865 |
| Immigrants | Kuwait | 97.4 /100 | #98 | Exceptional $109,731 |
| Armenians | 97.3 /100 | #99 | Exceptional $109,692 |
| Macedonians | 97.3 /100 | #100 | Exceptional $109,668 |
| Immigrants | Ukraine | 97.2 /100 | #101 | Exceptional $109,645 |
Demographics Similar to Carpatho Rusyns by Median Family Income
In terms of median family income, the demographic groups most similar to Carpatho Rusyns are Pakistani ($107,390, a difference of 0.11%), Taiwanese ($107,295, a difference of 0.19%), Immigrants from Jordan ($107,715, a difference of 0.20%), Serbian ($107,157, a difference of 0.32%), and Lebanese ($107,086, a difference of 0.39%).
| Demographics | Rating | Rank | Median Family Income |
| Chileans | 95.0 /100 | #116 | Exceptional $108,429 |
| Immigrants | Philippines | 94.6 /100 | #117 | Exceptional $108,288 |
| Ethiopians | 94.5 /100 | #118 | Exceptional $108,251 |
| Sri Lankans | 94.5 /100 | #119 | Exceptional $108,234 |
| Immigrants | Northern Africa | 94.3 /100 | #120 | Exceptional $108,161 |
| Europeans | 94.1 /100 | #121 | Exceptional $108,099 |
| Immigrants | Jordan | 92.9 /100 | #122 | Exceptional $107,715 |
| Carpatho Rusyns | 92.2 /100 | #123 | Exceptional $107,502 |
| Pakistanis | 91.7 /100 | #124 | Exceptional $107,390 |
| Taiwanese | 91.4 /100 | #125 | Exceptional $107,295 |
| Serbians | 90.8 /100 | #126 | Exceptional $107,157 |
| Lebanese | 90.5 /100 | #127 | Exceptional $107,086 |
| Immigrants | Ethiopia | 90.0 /100 | #128 | Excellent $106,969 |
| Arabs | 89.9 /100 | #129 | Excellent $106,952 |
| Brazilians | 89.8 /100 | #130 | Excellent $106,942 |