Immigrants from Kazakhstan vs Immigrants from Latvia Median Female Earnings

COMPARE

Immigrants from Kazakhstan
Race
Ancestry
AfghanAfricanAlaska NativeAlaskan AthabascanAlbanianAleutAlsatianAmericanApacheArabArapahoArgentineanArmenianAssyrian/Chaldean/SyriacAustralianAustrianBahamianBangladeshiBarbadianBasqueBelgianBelizeanBermudanBhutaneseBlackfeetBolivianBrazilianBritishBritish West IndianBulgarianBurmeseCajunCambodianCanadianCape VerdeanCarpatho RusynCelticCentral AmericanCentral American IndianCherokeeCheyenneChickasawChileanChineseChippewaChoctawColombianColvilleComancheCosta RicanCreeCreekCroatianCrowCubanCypriotCzechCzechoslovakianDanishDelawareDominicanDutchDutch West IndianEastern EuropeanEcuadorianEgyptianEnglishEstonianEthiopianEuropeanFijianFilipinoFinnishFrenchFrench American IndianFrench CanadianGermanGerman RussianGhanaianGreekGuamanian/ChamorroGuatemalanGuyaneseHaitianHmongHonduranHopiHoumaHungarianIcelanderIndian (Asian)IndonesianInupiatIranianIraqiIrishIroquoisIsraeliItalianJamaicanJapaneseJordanianKenyanKiowaKoreanLaotianLatvianLebaneseLiberianLithuanianLumbeeLuxembourgerMacedonianMalaysianMalteseMarshalleseMenomineeMexicanMexican American IndianMongolianMoroccanNative HawaiianNavajoNepaleseNew ZealanderNicaraguanNigerianNorthern EuropeanNorwegianOkinawanOsageOttawaPaiutePakistaniPalestinianPanamanianParaguayanPennsylvania GermanPeruvianPimaPolishPortuguesePotawatomiPuebloPuerto RicanPuget Sound SalishRomanianRussianSalvadoranSamoanScandinavianScotch-IrishScottishSeminoleSenegaleseSerbianShoshoneSierra LeoneanSiouxSlavicSlovakSloveneSomaliSouth AfricanSouth AmericanSouth American IndianSoviet UnionSpaniardSpanishSpanish AmericanSpanish American IndianSri LankanSubsaharan AfricanSudaneseSwedishSwissSyrianTaiwaneseThaiTlingit-HaidaTohono O'OdhamTonganTrinidadian and TobagonianTsimshianTurkishU.S. Virgin IslanderUgandanUkrainianUruguayanUteVenezuelanVietnameseWelshWest IndianYakamaYaquiYugoslavianYumanYup'ikZimbabwean
Immigration
NonimmigrantsImmigrantsAfghanistanAfricaAlbaniaArgentinaArmeniaAsiaAustraliaAustriaBahamasBangladeshBarbadosBelarusBelgiumBelizeBoliviaBosnia and HerzegovinaBrazilBulgariaBurma/MyanmarCabo VerdeCambodiaCameroonCanadaCaribbeanCentral AmericaChileChinaColombiaCongoCosta RicaCroatiaCubaCzechoslovakiaDenmarkDominicaDominican RepublicEastern AfricaEastern AsiaEastern EuropeEcuadorEgyptEl SalvadorEnglandEritreaEthiopiaEuropeFijiFranceGermanyGhanaGreeceGrenadaGuatemalaGuyanaHaitiHondurasHong KongHungaryIndiaIndonesiaIranIraqIrelandIsraelItalyJamaicaJapanJordanKazakhstanKenyaKoreaKuwaitLaosLatin AmericaLebanonLiberiaLithuaniaMalaysiaMexicoMicronesiaMiddle AfricaMoldovaMoroccoNepalNetherlandsNicaraguaNigeriaNorth AmericaNorth MacedoniaNorthern AfricaNorthern EuropeNorwayOceaniaPakistanPanamaPeruPhilippinesPolandPortugalRomaniaRussiaSaudi ArabiaScotlandSenegalSerbiaSierra LeoneSingaporeSomaliaSouth AfricaSouth AmericaSouth Central AsiaSouth Eastern AsiaSouthern EuropeSpainSri LankaSt. Vincent and the GrenadinesSudanSwedenSwitzerlandSyriaTaiwanThailandTrinidad and TobagoTurkeyUgandaUkraineUruguayUzbekistanVenezuelaVietnamWest IndiesWestern AfricaWestern AsiaWestern EuropeYemenZaireZimbabweAzores
Immigrants from Latvia
Race
Ancestry
AfghanAfricanAlaska NativeAlaskan AthabascanAlbanianAleutAlsatianAmericanApacheArabArapahoArgentineanArmenianAssyrian/Chaldean/SyriacAustralianAustrianBahamianBangladeshiBarbadianBasqueBelgianBelizeanBermudanBhutaneseBlackfeetBolivianBrazilianBritishBritish West IndianBulgarianBurmeseCajunCambodianCanadianCape VerdeanCarpatho RusynCelticCentral AmericanCentral American IndianCherokeeCheyenneChickasawChileanChineseChippewaChoctawColombianColvilleComancheCosta RicanCreeCreekCroatianCrowCubanCypriotCzechCzechoslovakianDanishDelawareDominicanDutchDutch West IndianEastern EuropeanEcuadorianEgyptianEnglishEstonianEthiopianEuropeanFijianFilipinoFinnishFrenchFrench American IndianFrench CanadianGermanGerman RussianGhanaianGreekGuamanian/ChamorroGuatemalanGuyaneseHaitianHmongHonduranHopiHoumaHungarianIcelanderIndian (Asian)IndonesianInupiatIranianIraqiIrishIroquoisIsraeliItalianJamaicanJapaneseJordanianKenyanKiowaKoreanLaotianLatvianLebaneseLiberianLithuanianLumbeeLuxembourgerMacedonianMalaysianMalteseMarshalleseMenomineeMexicanMexican American IndianMongolianMoroccanNative HawaiianNavajoNepaleseNew ZealanderNicaraguanNigerianNorthern EuropeanNorwegianOkinawanOsageOttawaPaiutePakistaniPalestinianPanamanianParaguayanPennsylvania GermanPeruvianPimaPolishPortuguesePotawatomiPuebloPuerto RicanPuget Sound SalishRomanianRussianSalvadoranSamoanScandinavianScotch-IrishScottishSeminoleSenegaleseSerbianShoshoneSierra LeoneanSiouxSlavicSlovakSloveneSomaliSouth AfricanSouth AmericanSouth American IndianSoviet UnionSpaniardSpanishSpanish AmericanSpanish American IndianSri LankanSubsaharan AfricanSudaneseSwedishSwissSyrianTaiwaneseThaiTlingit-HaidaTohono O'OdhamTonganTrinidadian and TobagonianTsimshianTurkishU.S. Virgin IslanderUgandanUkrainianUruguayanUteVenezuelanVietnameseWelshWest IndianYakamaYaquiYugoslavianYumanYup'ikZimbabwean
Immigration
NonimmigrantsImmigrantsAfghanistanAfricaAlbaniaArgentinaArmeniaAsiaAustraliaAustriaBahamasBangladeshBarbadosBelarusBelgiumBelizeBoliviaBosnia and HerzegovinaBrazilBulgariaBurma/MyanmarCabo VerdeCambodiaCameroonCanadaCaribbeanCentral AmericaChileChinaColombiaCongoCosta RicaCroatiaCubaCzechoslovakiaDenmarkDominicaDominican RepublicEastern AfricaEastern AsiaEastern EuropeEcuadorEgyptEl SalvadorEnglandEritreaEthiopiaEuropeFijiFranceGermanyGhanaGreeceGrenadaGuatemalaGuyanaHaitiHondurasHong KongHungaryIndiaIndonesiaIranIraqIrelandIsraelItalyJamaicaJapanJordanKenyaKoreaKuwaitLaosLatin AmericaLatviaLebanonLiberiaLithuaniaMalaysiaMexicoMicronesiaMiddle AfricaMoldovaMoroccoNepalNetherlandsNicaraguaNigeriaNorth AmericaNorth MacedoniaNorthern AfricaNorthern EuropeNorwayOceaniaPakistanPanamaPeruPhilippinesPolandPortugalRomaniaRussiaSaudi ArabiaScotlandSenegalSerbiaSierra LeoneSingaporeSomaliaSouth AfricaSouth AmericaSouth Central AsiaSouth Eastern AsiaSouthern EuropeSpainSri LankaSt. Vincent and the GrenadinesSudanSwedenSwitzerlandSyriaTaiwanThailandTrinidad and TobagoTurkeyUgandaUkraineUruguayUzbekistanVenezuelaVietnamWest IndiesWestern AfricaWestern AsiaWestern EuropeYemenZaireZimbabweAzores
Median Female Earnings
Income
Poverty
Unemployment
Labor Participation
Family Structure
Vehicle Availability
Education Level
Disability

Median Female Earnings Comparison

Immigrants from Kazakhstan

Immigrants from Latvia

Exceptional
Exceptional
$42,386
MEDIAN FEMALE EARNINGS
99.6/ 100
METRIC RATING
78th/ 347
METRIC RANK
$43,099
MEDIAN FEMALE EARNINGS
99.9/ 100
METRIC RATING
60th/ 347
METRIC RANK

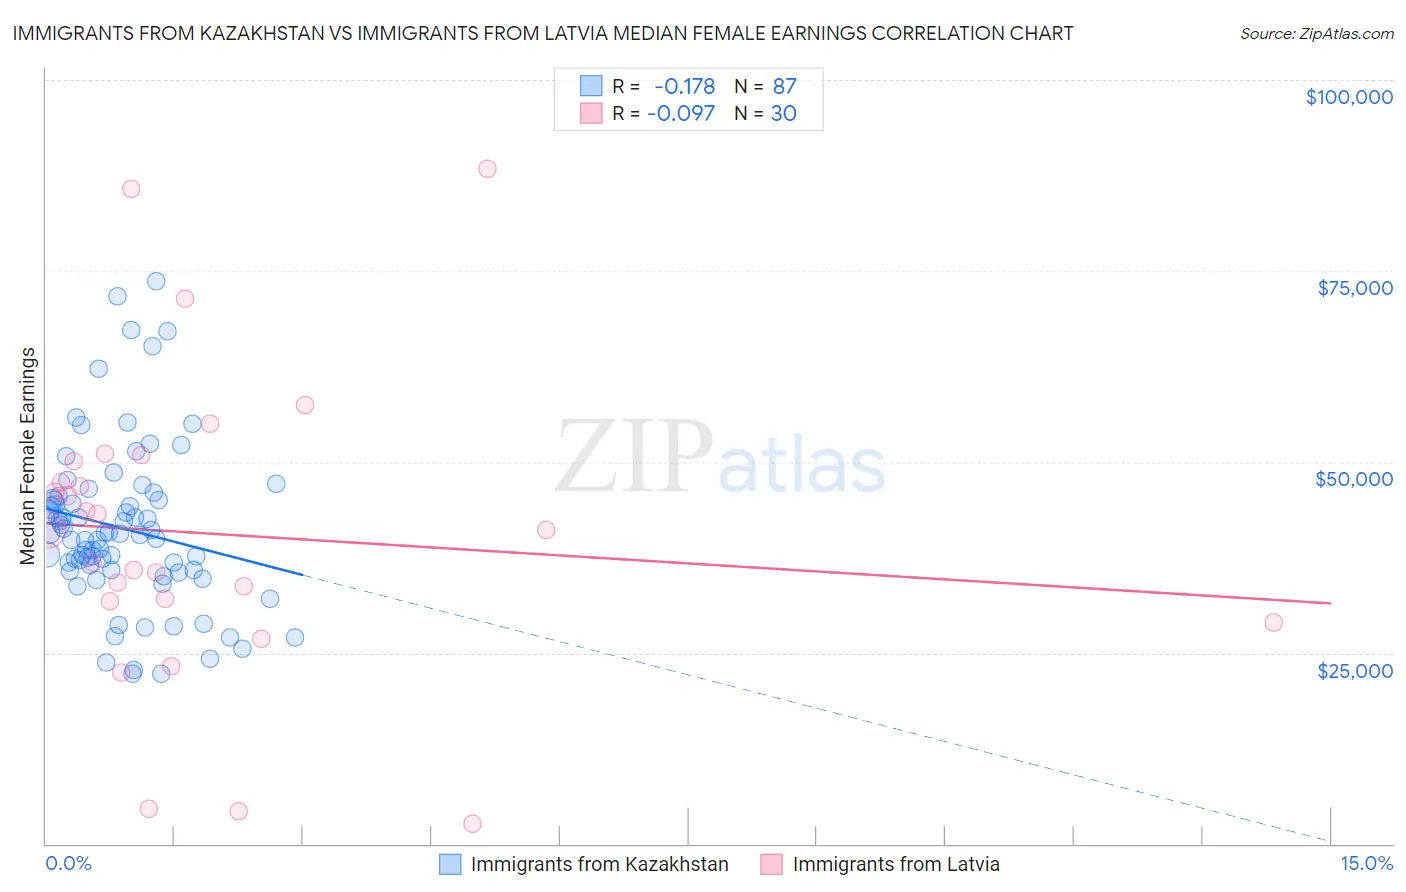
Immigrants from Kazakhstan vs Immigrants from Latvia Median Female Earnings Correlation Chart

The statistical analysis conducted on geographies consisting of 124,420,092 people shows a poor negative correlation between the proportion of Immigrants from Kazakhstan and median female earnings in the United States with a correlation coefficient (R) of -0.178 and weighted average of $42,386. Similarly, the statistical analysis conducted on geographies consisting of 113,735,642 people shows a slight negative correlation between the proportion of Immigrants from Latvia and median female earnings in the United States with a correlation coefficient (R) of -0.097 and weighted average of $43,099, a difference of 1.7%.
Immigrants from Kazakhstan vs Immigrants from Latvia Median Female Earnings

Median Female Earnings Correlation Summary

MeasurementImmigrants from KazakhstanImmigrants from Latvia
Minimum$22,250$2,606
Maximum$73,684$88,365
Range$51,434$85,759
Mean$41,300$40,583
Median$40,614$41,080
Interquartile 25% (IQ1)$35,762$31,765
Interquartile 75% (IQ3)$45,166$50,109
Interquartile Range (IQR)$9,404$18,344
Standard Deviation (Sample)$10,623$19,932
Standard Deviation (Population)$10,562$19,597

Demographics Similar to Immigrants from Kazakhstan and Immigrants from Latvia by Median Female Earnings

In terms of median female earnings, the demographic groups most similar to Immigrants from Kazakhstan are Immigrants from Albania ($42,388, a difference of 0.0%), Greek ($42,336, a difference of 0.12%), New Zealander ($42,446, a difference of 0.14%), Immigrants from Italy ($42,446, a difference of 0.14%), and Immigrants from South Africa ($42,508, a difference of 0.29%). Similarly, the demographic groups most similar to Immigrants from Latvia are Estonian ($43,106, a difference of 0.020%), Immigrants from Bulgaria ($43,085, a difference of 0.030%), Afghan ($43,077, a difference of 0.050%), Immigrants from Ukraine ($43,069, a difference of 0.070%), and Immigrants from Pakistan ($43,052, a difference of 0.11%).
DemographicsRating | RankMedian Female Earnings
Estonians
99.9
/100
|
#59
Exceptional
$43,106
Immigrants | Latvia
99.9
/100
|
#60
Exceptional
$43,099
Immigrants | Bulgaria
99.9
/100
|
#61
Exceptional
$43,085
Afghans
99.9
/100
|
#62
Exceptional
$43,077
Immigrants | Ukraine
99.9
/100
|
#63
Exceptional
$43,069
Immigrants | Pakistan
99.9
/100
|
#64
Exceptional
$43,052
Sierra Leoneans
99.9
/100
|
#65
Exceptional
$42,868
Immigrants | Norway
99.9
/100
|
#66
Exceptional
$42,837
Immigrants | Egypt
99.9
/100
|
#67
Exceptional
$42,837
Immigrants | Austria
99.8
/100
|
#68
Exceptional
$42,824
Immigrants | Spain
99.8
/100
|
#69
Exceptional
$42,815
Immigrants | Ethiopia
99.8
/100
|
#70
Exceptional
$42,744
Immigrants | Romania
99.8
/100
|
#71
Exceptional
$42,718
Albanians
99.8
/100
|
#72
Exceptional
$42,584
Mongolians
99.7
/100
|
#73
Exceptional
$42,542
Immigrants | South Africa
99.7
/100
|
#74
Exceptional
$42,508
New Zealanders
99.7
/100
|
#75
Exceptional
$42,446
Immigrants | Italy
99.7
/100
|
#76
Exceptional
$42,446
Immigrants | Albania
99.6
/100
|
#77
Exceptional
$42,388
Immigrants | Kazakhstan
99.6
/100
|
#78
Exceptional
$42,386
Greeks
99.6
/100
|
#79
Exceptional
$42,336