Afghan vs Immigrants from Latvia Median Female Earnings
COMPARE
Afghan
Immigrants from Latvia
Median Female Earnings
Median Female Earnings Comparison
Afghans
Immigrants from Latvia
$43,077
MEDIAN FEMALE EARNINGS
99.9/ 100
METRIC RATING
62nd/ 347
METRIC RANK
$43,099
MEDIAN FEMALE EARNINGS
99.9/ 100
METRIC RATING
60th/ 347
METRIC RANK
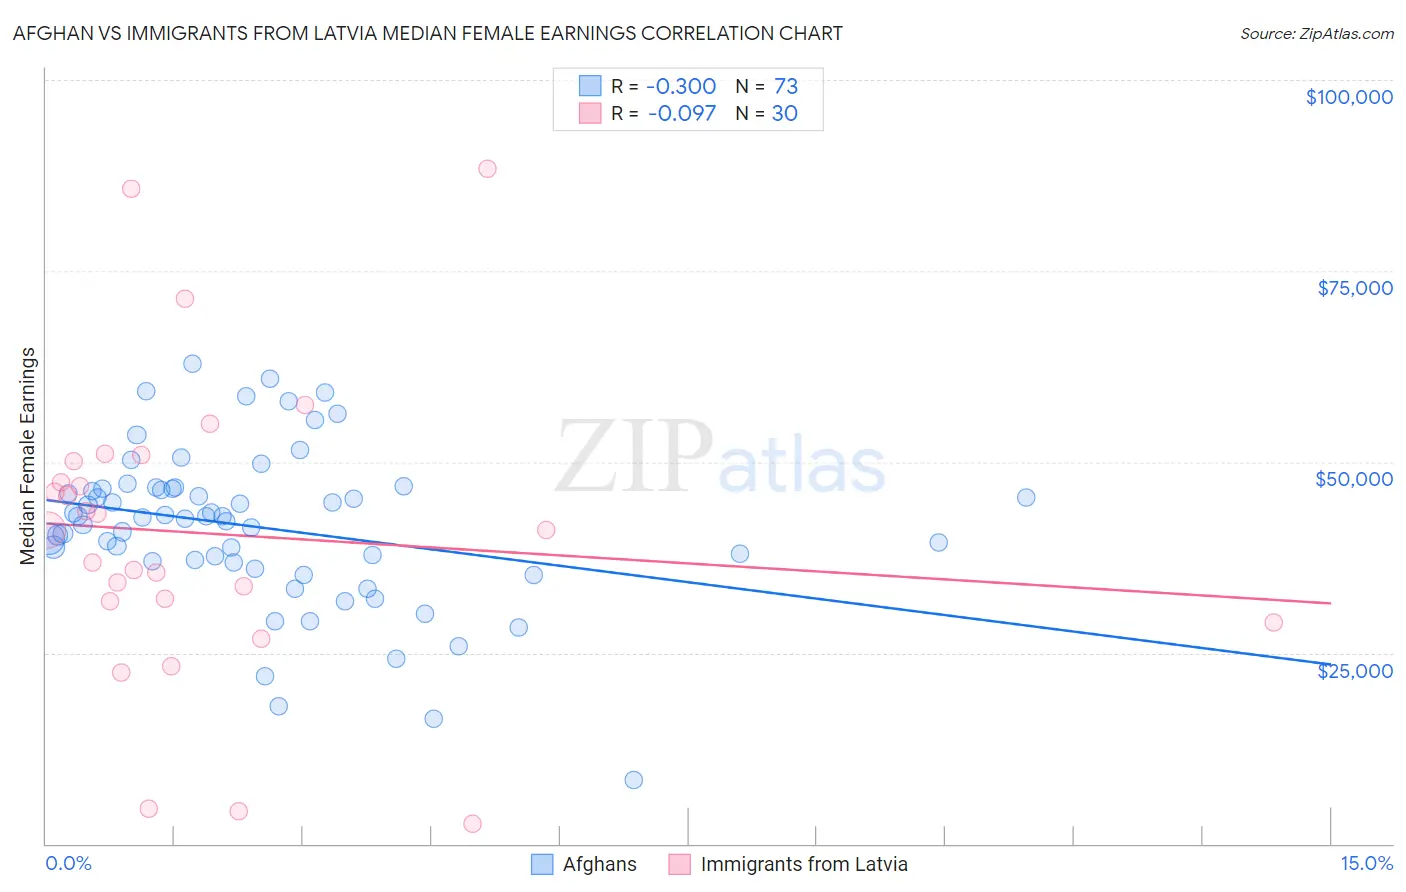
Afghan vs Immigrants from Latvia Median Female Earnings Correlation Chart
The statistical analysis conducted on geographies consisting of 148,870,057 people shows a mild negative correlation between the proportion of Afghans and median female earnings in the United States with a correlation coefficient (R) of -0.300 and weighted average of $43,077. Similarly, the statistical analysis conducted on geographies consisting of 113,735,642 people shows a slight negative correlation between the proportion of Immigrants from Latvia and median female earnings in the United States with a correlation coefficient (R) of -0.097 and weighted average of $43,099, a difference of 0.050%.
Median Female Earnings Correlation Summary
| Measurement | Afghan | Immigrants from Latvia |
| Minimum | $8,380 | $2,606 |
| Maximum | $62,780 | $88,365 |
| Range | $54,400 | $85,759 |
| Mean | $41,426 | $40,583 |
| Median | $42,748 | $41,080 |
| Interquartile 25% (IQ1) | $36,907 | $31,765 |
| Interquartile 75% (IQ3) | $46,506 | $50,109 |
| Interquartile Range (IQR) | $9,599 | $18,344 |
| Standard Deviation (Sample) | $10,289 | $19,932 |
| Standard Deviation (Population) | $10,218 | $19,597 |
Demographics Similar to Afghans and Immigrants from Latvia by Median Female Earnings
In terms of median female earnings, the demographic groups most similar to Afghans are Immigrants from Bulgaria ($43,085, a difference of 0.020%), Immigrants from Ukraine ($43,069, a difference of 0.020%), Immigrants from Pakistan ($43,052, a difference of 0.060%), Estonian ($43,106, a difference of 0.070%), and Paraguayan ($43,173, a difference of 0.22%). Similarly, the demographic groups most similar to Immigrants from Latvia are Estonian ($43,106, a difference of 0.020%), Immigrants from Bulgaria ($43,085, a difference of 0.030%), Immigrants from Ukraine ($43,069, a difference of 0.070%), Immigrants from Pakistan ($43,052, a difference of 0.11%), and Paraguayan ($43,173, a difference of 0.17%).
| Demographics | Rating | Rank | Median Female Earnings |
| Maltese | 100.0 /100 | #51 | Exceptional $43,357 |
| Immigrants | Lithuania | 99.9 /100 | #52 | Exceptional $43,317 |
| Immigrants | Eastern Europe | 99.9 /100 | #53 | Exceptional $43,309 |
| Australians | 99.9 /100 | #54 | Exceptional $43,308 |
| Egyptians | 99.9 /100 | #55 | Exceptional $43,305 |
| Immigrants | Croatia | 99.9 /100 | #56 | Exceptional $43,258 |
| Ethiopians | 99.9 /100 | #57 | Exceptional $43,243 |
| Paraguayans | 99.9 /100 | #58 | Exceptional $43,173 |
| Estonians | 99.9 /100 | #59 | Exceptional $43,106 |
| Immigrants | Latvia | 99.9 /100 | #60 | Exceptional $43,099 |
| Immigrants | Bulgaria | 99.9 /100 | #61 | Exceptional $43,085 |
| Afghans | 99.9 /100 | #62 | Exceptional $43,077 |
| Immigrants | Ukraine | 99.9 /100 | #63 | Exceptional $43,069 |
| Immigrants | Pakistan | 99.9 /100 | #64 | Exceptional $43,052 |
| Sierra Leoneans | 99.9 /100 | #65 | Exceptional $42,868 |
| Immigrants | Norway | 99.9 /100 | #66 | Exceptional $42,837 |
| Immigrants | Egypt | 99.9 /100 | #67 | Exceptional $42,837 |
| Immigrants | Austria | 99.8 /100 | #68 | Exceptional $42,824 |
| Immigrants | Spain | 99.8 /100 | #69 | Exceptional $42,815 |
| Immigrants | Ethiopia | 99.8 /100 | #70 | Exceptional $42,744 |
| Immigrants | Romania | 99.8 /100 | #71 | Exceptional $42,718 |