Cree vs Immigrants from Latvia Hearing Disability
COMPARE
Cree
Immigrants from Latvia
Hearing Disability
Hearing Disability Comparison
Cree
Immigrants from Latvia
3.8%
HEARING DISABILITY
0.0/ 100
METRIC RATING
310th/ 347
METRIC RANK
3.1%
HEARING DISABILITY
12.7/ 100
METRIC RATING
208th/ 347
METRIC RANK
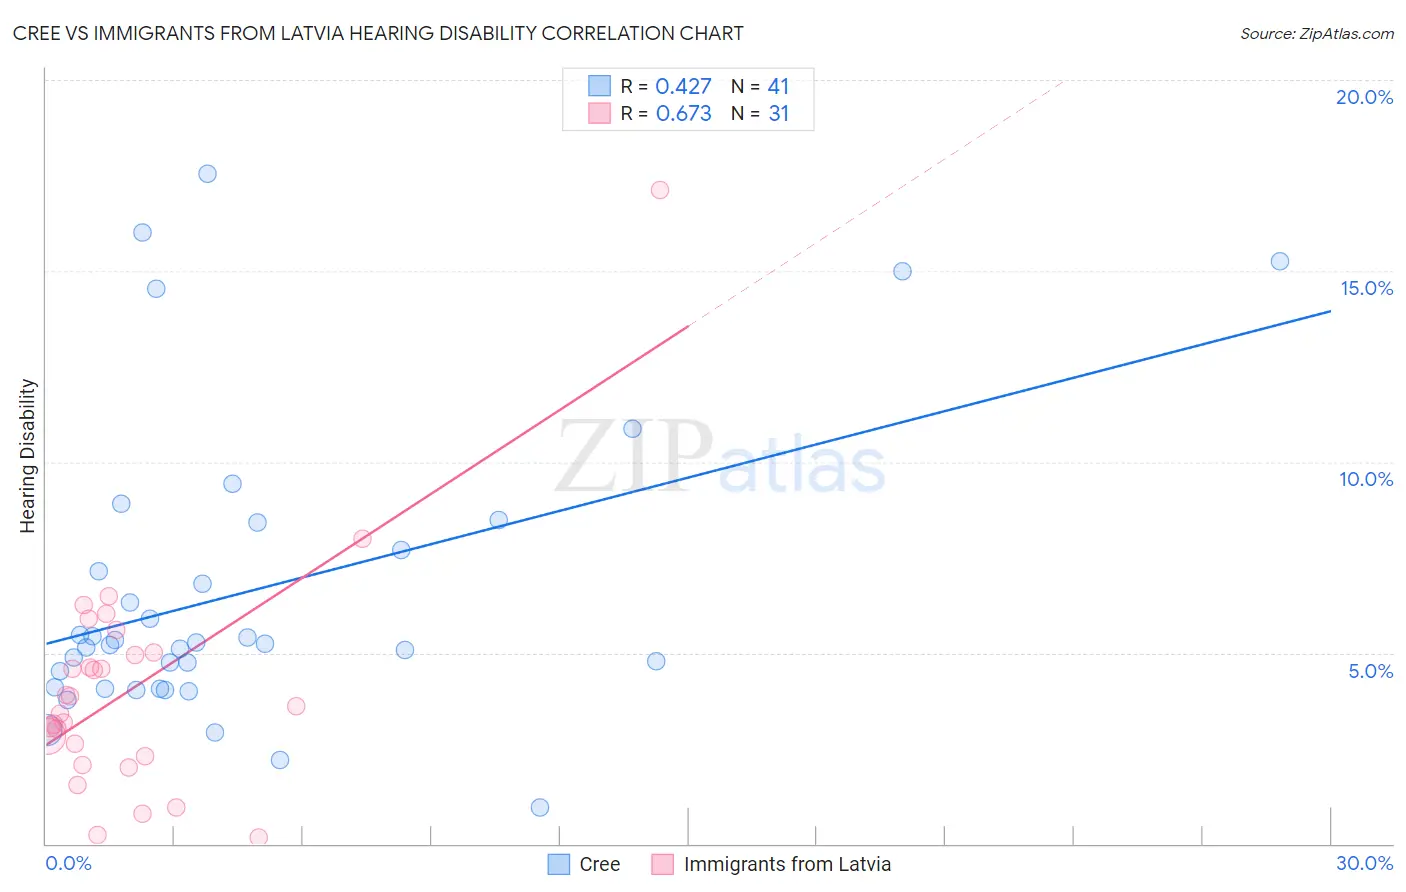
Cree vs Immigrants from Latvia Hearing Disability Correlation Chart
The statistical analysis conducted on geographies consisting of 76,207,567 people shows a moderate positive correlation between the proportion of Cree and percentage of population with hearing disability in the United States with a correlation coefficient (R) of 0.427 and weighted average of 3.8%. Similarly, the statistical analysis conducted on geographies consisting of 113,736,493 people shows a significant positive correlation between the proportion of Immigrants from Latvia and percentage of population with hearing disability in the United States with a correlation coefficient (R) of 0.673 and weighted average of 3.1%, a difference of 22.8%.
Hearing Disability Correlation Summary
| Measurement | Cree | Immigrants from Latvia |
| Minimum | 0.96% | 0.16% |
| Maximum | 17.6% | 17.1% |
| Range | 16.6% | 17.0% |
| Mean | 6.6% | 4.1% |
| Median | 5.2% | 3.6% |
| Interquartile 25% (IQ1) | 4.1% | 2.3% |
| Interquartile 75% (IQ3) | 8.0% | 5.0% |
| Interquartile Range (IQR) | 4.0% | 2.7% |
| Standard Deviation (Sample) | 3.9% | 3.1% |
| Standard Deviation (Population) | 3.9% | 3.0% |
Similar Demographics by Hearing Disability
Demographics Similar to Cree by Hearing Disability
In terms of hearing disability, the demographic groups most similar to Cree are Scotch-Irish (3.8%, a difference of 0.31%), Ottawa (3.8%, a difference of 0.39%), French Canadian (3.8%, a difference of 0.83%), Marshallese (3.8%, a difference of 0.95%), and American (3.9%, a difference of 1.3%).
| Demographics | Rating | Rank | Hearing Disability |
| Menominee | 0.0 /100 | #303 | Tragic 3.7% |
| French | 0.0 /100 | #304 | Tragic 3.8% |
| English | 0.0 /100 | #305 | Tragic 3.8% |
| Marshallese | 0.0 /100 | #306 | Tragic 3.8% |
| French Canadians | 0.0 /100 | #307 | Tragic 3.8% |
| Ottawa | 0.0 /100 | #308 | Tragic 3.8% |
| Scotch-Irish | 0.0 /100 | #309 | Tragic 3.8% |
| Cree | 0.0 /100 | #310 | Tragic 3.8% |
| Americans | 0.0 /100 | #311 | Tragic 3.9% |
| Cajuns | 0.0 /100 | #312 | Tragic 3.9% |
| Hopi | 0.0 /100 | #313 | Tragic 3.9% |
| Yakama | 0.0 /100 | #314 | Tragic 3.9% |
| Puget Sound Salish | 0.0 /100 | #315 | Tragic 3.9% |
| Spanish Americans | 0.0 /100 | #316 | Tragic 4.0% |
| Comanche | 0.0 /100 | #317 | Tragic 4.0% |
Demographics Similar to Immigrants from Latvia by Hearing Disability
In terms of hearing disability, the demographic groups most similar to Immigrants from Latvia are Immigrants from Hungary (3.1%, a difference of 0.040%), Cape Verdean (3.1%, a difference of 0.090%), Romanian (3.1%, a difference of 0.13%), Pakistani (3.1%, a difference of 0.33%), and Hispanic or Latino (3.1%, a difference of 0.46%).
| Demographics | Rating | Rank | Hearing Disability |
| Iraqis | 19.0 /100 | #201 | Poor 3.1% |
| Immigrants | Thailand | 16.4 /100 | #202 | Poor 3.1% |
| Immigrants | Denmark | 16.2 /100 | #203 | Poor 3.1% |
| Immigrants | Czechoslovakia | 15.9 /100 | #204 | Poor 3.1% |
| Alsatians | 15.9 /100 | #205 | Poor 3.1% |
| Eastern Europeans | 15.5 /100 | #206 | Poor 3.1% |
| Hispanics or Latinos | 15.1 /100 | #207 | Poor 3.1% |
| Immigrants | Latvia | 12.7 /100 | #208 | Poor 3.1% |
| Immigrants | Hungary | 12.5 /100 | #209 | Poor 3.1% |
| Cape Verdeans | 12.2 /100 | #210 | Poor 3.1% |
| Romanians | 12.1 /100 | #211 | Poor 3.1% |
| Pakistanis | 11.1 /100 | #212 | Poor 3.1% |
| Immigrants | Iraq | 10.5 /100 | #213 | Poor 3.1% |
| Australians | 8.1 /100 | #214 | Tragic 3.2% |
| Bangladeshis | 8.1 /100 | #215 | Tragic 3.2% |