Cree vs Immigrants from Latvia In Labor Force | Age 25-29
COMPARE
Cree
Immigrants from Latvia
In Labor Force | Age 25-29
In Labor Force | Age 25-29 Comparison
Cree
Immigrants from Latvia
83.8%
IN LABOR FORCE | AGE 25-29
0.3/ 100
METRIC RATING
246th/ 347
METRIC RANK
85.6%
IN LABOR FORCE | AGE 25-29
99.8/ 100
METRIC RATING
51st/ 347
METRIC RANK
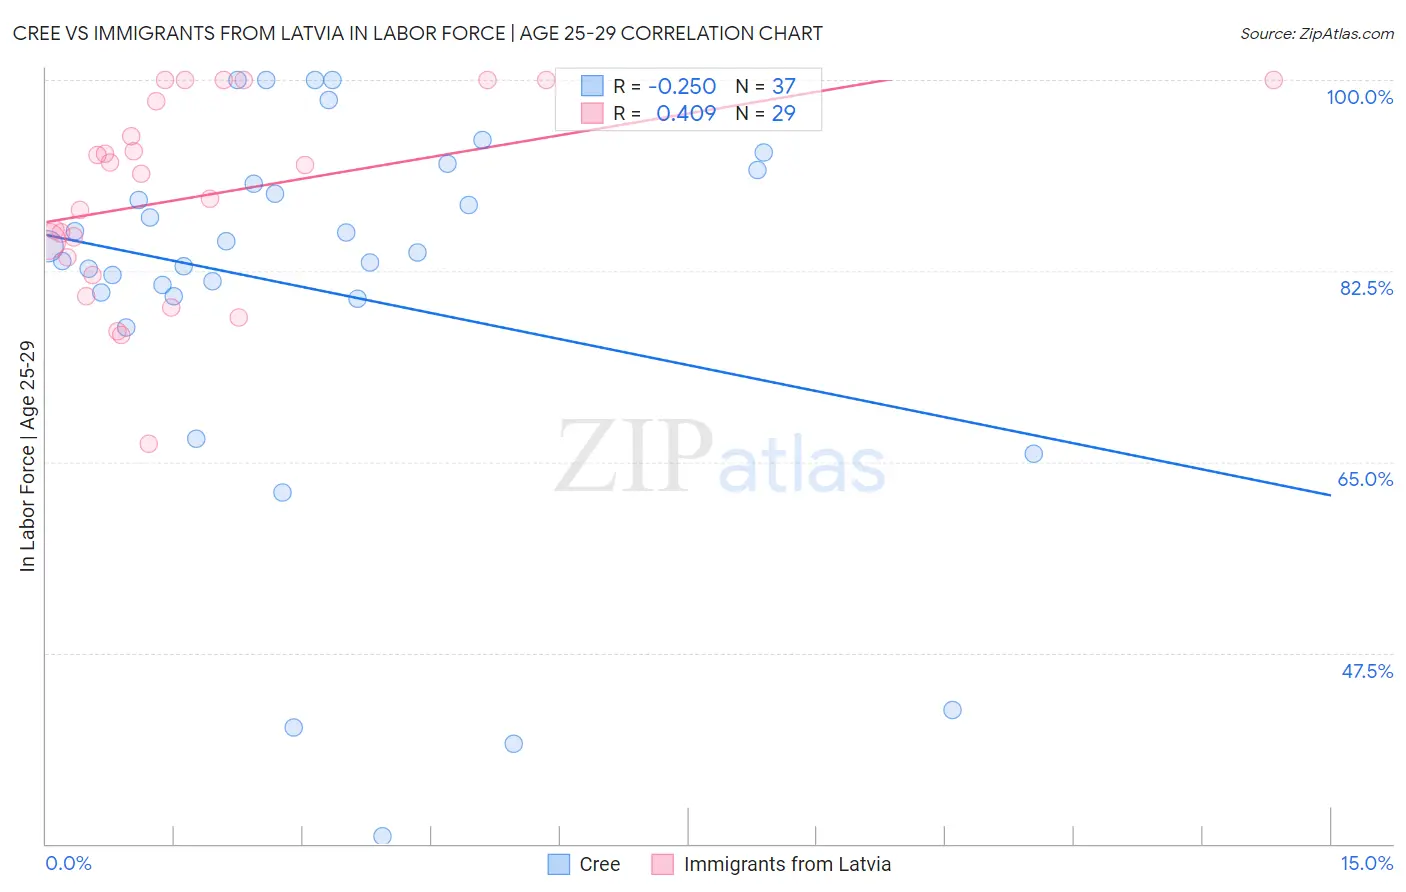
Cree vs Immigrants from Latvia In Labor Force | Age 25-29 Correlation Chart
The statistical analysis conducted on geographies consisting of 76,193,798 people shows a weak negative correlation between the proportion of Cree and labor force participation rate among population between the ages 25 and 29 in the United States with a correlation coefficient (R) of -0.250 and weighted average of 83.8%. Similarly, the statistical analysis conducted on geographies consisting of 113,730,924 people shows a moderate positive correlation between the proportion of Immigrants from Latvia and labor force participation rate among population between the ages 25 and 29 in the United States with a correlation coefficient (R) of 0.409 and weighted average of 85.6%, a difference of 2.2%.
In Labor Force | Age 25-29 Correlation Summary
| Measurement | Cree | Immigrants from Latvia |
| Minimum | 30.7% | 66.7% |
| Maximum | 100.0% | 100.0% |
| Range | 69.3% | 33.3% |
| Mean | 80.7% | 89.4% |
| Median | 84.2% | 91.5% |
| Interquartile 25% (IQ1) | 80.1% | 83.0% |
| Interquartile 75% (IQ3) | 91.1% | 99.0% |
| Interquartile Range (IQR) | 11.0% | 16.0% |
| Standard Deviation (Sample) | 17.4% | 9.0% |
| Standard Deviation (Population) | 17.2% | 8.8% |
Similar Demographics by In Labor Force | Age 25-29
Demographics Similar to Cree by In Labor Force | Age 25-29
In terms of in labor force | age 25-29, the demographic groups most similar to Cree are Immigrants from El Salvador (83.7%, a difference of 0.020%), Nonimmigrants (83.7%, a difference of 0.030%), Hmong (83.7%, a difference of 0.040%), Immigrants from Jamaica (83.8%, a difference of 0.050%), and Iroquois (83.8%, a difference of 0.050%).
| Demographics | Rating | Rank | In Labor Force | Age 25-29 |
| Jamaicans | 0.8 /100 | #239 | Tragic 83.9% |
| Trinidadians and Tobagonians | 0.7 /100 | #240 | Tragic 83.9% |
| Alsatians | 0.7 /100 | #241 | Tragic 83.9% |
| U.S. Virgin Islanders | 0.6 /100 | #242 | Tragic 83.8% |
| Salvadorans | 0.5 /100 | #243 | Tragic 83.8% |
| Immigrants | Jamaica | 0.4 /100 | #244 | Tragic 83.8% |
| Iroquois | 0.4 /100 | #245 | Tragic 83.8% |
| Cree | 0.3 /100 | #246 | Tragic 83.8% |
| Immigrants | El Salvador | 0.3 /100 | #247 | Tragic 83.7% |
| Immigrants | Nonimmigrants | 0.3 /100 | #248 | Tragic 83.7% |
| Hmong | 0.3 /100 | #249 | Tragic 83.7% |
| Central Americans | 0.2 /100 | #250 | Tragic 83.7% |
| Bahamians | 0.2 /100 | #251 | Tragic 83.7% |
| Guatemalans | 0.2 /100 | #252 | Tragic 83.7% |
| Immigrants | Trinidad and Tobago | 0.2 /100 | #253 | Tragic 83.7% |
Demographics Similar to Immigrants from Latvia by In Labor Force | Age 25-29
In terms of in labor force | age 25-29, the demographic groups most similar to Immigrants from Latvia are Yugoslavian (85.6%, a difference of 0.0%), Immigrants from Poland (85.6%, a difference of 0.020%), Swedish (85.6%, a difference of 0.030%), Italian (85.6%, a difference of 0.040%), and Turkish (85.6%, a difference of 0.050%).
| Demographics | Rating | Rank | In Labor Force | Age 25-29 |
| Macedonians | 99.9 /100 | #44 | Exceptional 85.7% |
| Immigrants | Sierra Leone | 99.9 /100 | #45 | Exceptional 85.7% |
| Czechs | 99.8 /100 | #46 | Exceptional 85.6% |
| Turks | 99.8 /100 | #47 | Exceptional 85.6% |
| Italians | 99.8 /100 | #48 | Exceptional 85.6% |
| Swedes | 99.8 /100 | #49 | Exceptional 85.6% |
| Yugoslavians | 99.8 /100 | #50 | Exceptional 85.6% |
| Immigrants | Latvia | 99.8 /100 | #51 | Exceptional 85.6% |
| Immigrants | Poland | 99.7 /100 | #52 | Exceptional 85.6% |
| Belgians | 99.7 /100 | #53 | Exceptional 85.5% |
| Albanians | 99.7 /100 | #54 | Exceptional 85.5% |
| Immigrants | Brazil | 99.7 /100 | #55 | Exceptional 85.5% |
| Eastern Europeans | 99.6 /100 | #56 | Exceptional 85.5% |
| Estonians | 99.6 /100 | #57 | Exceptional 85.5% |
| Greeks | 99.6 /100 | #58 | Exceptional 85.5% |