Immigrants from Philippines vs Immigrants from Latvia Median Female Earnings

COMPARE

Immigrants from Philippines
Race
Ancestry
AfghanAfricanAlaska NativeAlaskan AthabascanAlbanianAleutAlsatianAmericanApacheArabArapahoArgentineanArmenianAssyrian/Chaldean/SyriacAustralianAustrianBahamianBangladeshiBarbadianBasqueBelgianBelizeanBermudanBhutaneseBlackfeetBolivianBrazilianBritishBritish West IndianBulgarianBurmeseCajunCambodianCanadianCape VerdeanCarpatho RusynCelticCentral AmericanCentral American IndianCherokeeCheyenneChickasawChileanChineseChippewaChoctawColombianColvilleComancheCosta RicanCreeCreekCroatianCrowCubanCypriotCzechCzechoslovakianDanishDelawareDominicanDutchDutch West IndianEastern EuropeanEcuadorianEgyptianEnglishEstonianEthiopianEuropeanFijianFilipinoFinnishFrenchFrench American IndianFrench CanadianGermanGerman RussianGhanaianGreekGuamanian/ChamorroGuatemalanGuyaneseHaitianHmongHonduranHopiHoumaHungarianIcelanderIndian (Asian)IndonesianInupiatIranianIraqiIrishIroquoisIsraeliItalianJamaicanJapaneseJordanianKenyanKiowaKoreanLaotianLatvianLebaneseLiberianLithuanianLumbeeLuxembourgerMacedonianMalaysianMalteseMarshalleseMenomineeMexicanMexican American IndianMongolianMoroccanNative HawaiianNavajoNepaleseNew ZealanderNicaraguanNigerianNorthern EuropeanNorwegianOkinawanOsageOttawaPaiutePakistaniPalestinianPanamanianParaguayanPennsylvania GermanPeruvianPimaPolishPortuguesePotawatomiPuebloPuerto RicanPuget Sound SalishRomanianRussianSalvadoranSamoanScandinavianScotch-IrishScottishSeminoleSenegaleseSerbianShoshoneSierra LeoneanSiouxSlavicSlovakSloveneSomaliSouth AfricanSouth AmericanSouth American IndianSoviet UnionSpaniardSpanishSpanish AmericanSpanish American IndianSri LankanSubsaharan AfricanSudaneseSwedishSwissSyrianTaiwaneseThaiTlingit-HaidaTohono O'OdhamTonganTrinidadian and TobagonianTsimshianTurkishU.S. Virgin IslanderUgandanUkrainianUruguayanUteVenezuelanVietnameseWelshWest IndianYakamaYaquiYugoslavianYumanYup'ikZimbabwean
Immigration
NonimmigrantsImmigrantsAfghanistanAfricaAlbaniaArgentinaArmeniaAsiaAustraliaAustriaBahamasBangladeshBarbadosBelarusBelgiumBelizeBoliviaBosnia and HerzegovinaBrazilBulgariaBurma/MyanmarCabo VerdeCambodiaCameroonCanadaCaribbeanCentral AmericaChileChinaColombiaCongoCosta RicaCroatiaCubaCzechoslovakiaDenmarkDominicaDominican RepublicEastern AfricaEastern AsiaEastern EuropeEcuadorEgyptEl SalvadorEnglandEritreaEthiopiaEuropeFijiFranceGermanyGhanaGreeceGrenadaGuatemalaGuyanaHaitiHondurasHong KongHungaryIndiaIndonesiaIranIraqIrelandIsraelItalyJamaicaJapanJordanKazakhstanKenyaKoreaKuwaitLaosLatin AmericaLebanonLiberiaLithuaniaMalaysiaMexicoMicronesiaMiddle AfricaMoldovaMoroccoNepalNetherlandsNicaraguaNigeriaNorth AmericaNorth MacedoniaNorthern AfricaNorthern EuropeNorwayOceaniaPakistanPanamaPeruPhilippinesPolandPortugalRomaniaRussiaSaudi ArabiaScotlandSenegalSerbiaSierra LeoneSingaporeSomaliaSouth AfricaSouth AmericaSouth Central AsiaSouth Eastern AsiaSouthern EuropeSpainSri LankaSt. Vincent and the GrenadinesSudanSwedenSwitzerlandSyriaTaiwanThailandTrinidad and TobagoTurkeyUgandaUkraineUruguayUzbekistanVenezuelaVietnamWest IndiesWestern AfricaWestern AsiaWestern EuropeYemenZaireZimbabweAzores
Immigrants from Latvia
Race
Ancestry
AfghanAfricanAlaska NativeAlaskan AthabascanAlbanianAleutAlsatianAmericanApacheArabArapahoArgentineanArmenianAssyrian/Chaldean/SyriacAustralianAustrianBahamianBangladeshiBarbadianBasqueBelgianBelizeanBermudanBhutaneseBlackfeetBolivianBrazilianBritishBritish West IndianBulgarianBurmeseCajunCambodianCanadianCape VerdeanCarpatho RusynCelticCentral AmericanCentral American IndianCherokeeCheyenneChickasawChileanChineseChippewaChoctawColombianColvilleComancheCosta RicanCreeCreekCroatianCrowCubanCypriotCzechCzechoslovakianDanishDelawareDominicanDutchDutch West IndianEastern EuropeanEcuadorianEgyptianEnglishEstonianEthiopianEuropeanFijianFilipinoFinnishFrenchFrench American IndianFrench CanadianGermanGerman RussianGhanaianGreekGuamanian/ChamorroGuatemalanGuyaneseHaitianHmongHonduranHopiHoumaHungarianIcelanderIndian (Asian)IndonesianInupiatIranianIraqiIrishIroquoisIsraeliItalianJamaicanJapaneseJordanianKenyanKiowaKoreanLaotianLatvianLebaneseLiberianLithuanianLumbeeLuxembourgerMacedonianMalaysianMalteseMarshalleseMenomineeMexicanMexican American IndianMongolianMoroccanNative HawaiianNavajoNepaleseNew ZealanderNicaraguanNigerianNorthern EuropeanNorwegianOkinawanOsageOttawaPaiutePakistaniPalestinianPanamanianParaguayanPennsylvania GermanPeruvianPimaPolishPortuguesePotawatomiPuebloPuerto RicanPuget Sound SalishRomanianRussianSalvadoranSamoanScandinavianScotch-IrishScottishSeminoleSenegaleseSerbianShoshoneSierra LeoneanSiouxSlavicSlovakSloveneSomaliSouth AfricanSouth AmericanSouth American IndianSoviet UnionSpaniardSpanishSpanish AmericanSpanish American IndianSri LankanSubsaharan AfricanSudaneseSwedishSwissSyrianTaiwaneseThaiTlingit-HaidaTohono O'OdhamTonganTrinidadian and TobagonianTsimshianTurkishU.S. Virgin IslanderUgandanUkrainianUruguayanUteVenezuelanVietnameseWelshWest IndianYakamaYaquiYugoslavianYumanYup'ikZimbabwean
Immigration
NonimmigrantsImmigrantsAfghanistanAfricaAlbaniaArgentinaArmeniaAsiaAustraliaAustriaBahamasBangladeshBarbadosBelarusBelgiumBelizeBoliviaBosnia and HerzegovinaBrazilBulgariaBurma/MyanmarCabo VerdeCambodiaCameroonCanadaCaribbeanCentral AmericaChileChinaColombiaCongoCosta RicaCroatiaCubaCzechoslovakiaDenmarkDominicaDominican RepublicEastern AfricaEastern AsiaEastern EuropeEcuadorEgyptEl SalvadorEnglandEritreaEthiopiaEuropeFijiFranceGermanyGhanaGreeceGrenadaGuatemalaGuyanaHaitiHondurasHong KongHungaryIndiaIndonesiaIranIraqIrelandIsraelItalyJamaicaJapanJordanKazakhstanKenyaKoreaKuwaitLaosLatin AmericaLatviaLebanonLiberiaLithuaniaMalaysiaMexicoMicronesiaMiddle AfricaMoldovaMoroccoNepalNetherlandsNicaraguaNigeriaNorth AmericaNorth MacedoniaNorthern AfricaNorthern EuropeNorwayOceaniaPakistanPanamaPeruPolandPortugalRomaniaRussiaSaudi ArabiaScotlandSenegalSerbiaSierra LeoneSingaporeSomaliaSouth AfricaSouth AmericaSouth Central AsiaSouth Eastern AsiaSouthern EuropeSpainSri LankaSt. Vincent and the GrenadinesSudanSwedenSwitzerlandSyriaTaiwanThailandTrinidad and TobagoTurkeyUgandaUkraineUruguayUzbekistanVenezuelaVietnamWest IndiesWestern AfricaWestern AsiaWestern EuropeYemenZaireZimbabweAzores
Median Female Earnings
Income
Poverty
Unemployment
Labor Participation
Family Structure
Vehicle Availability
Education Level
Disability

Median Female Earnings Comparison

Immigrants from Philippines

Immigrants from Latvia

Exceptional
Exceptional
$41,114
MEDIAN FEMALE EARNINGS
95.0/ 100
METRIC RATING
119th/ 347
METRIC RANK
$43,099
MEDIAN FEMALE EARNINGS
99.9/ 100
METRIC RATING
60th/ 347
METRIC RANK

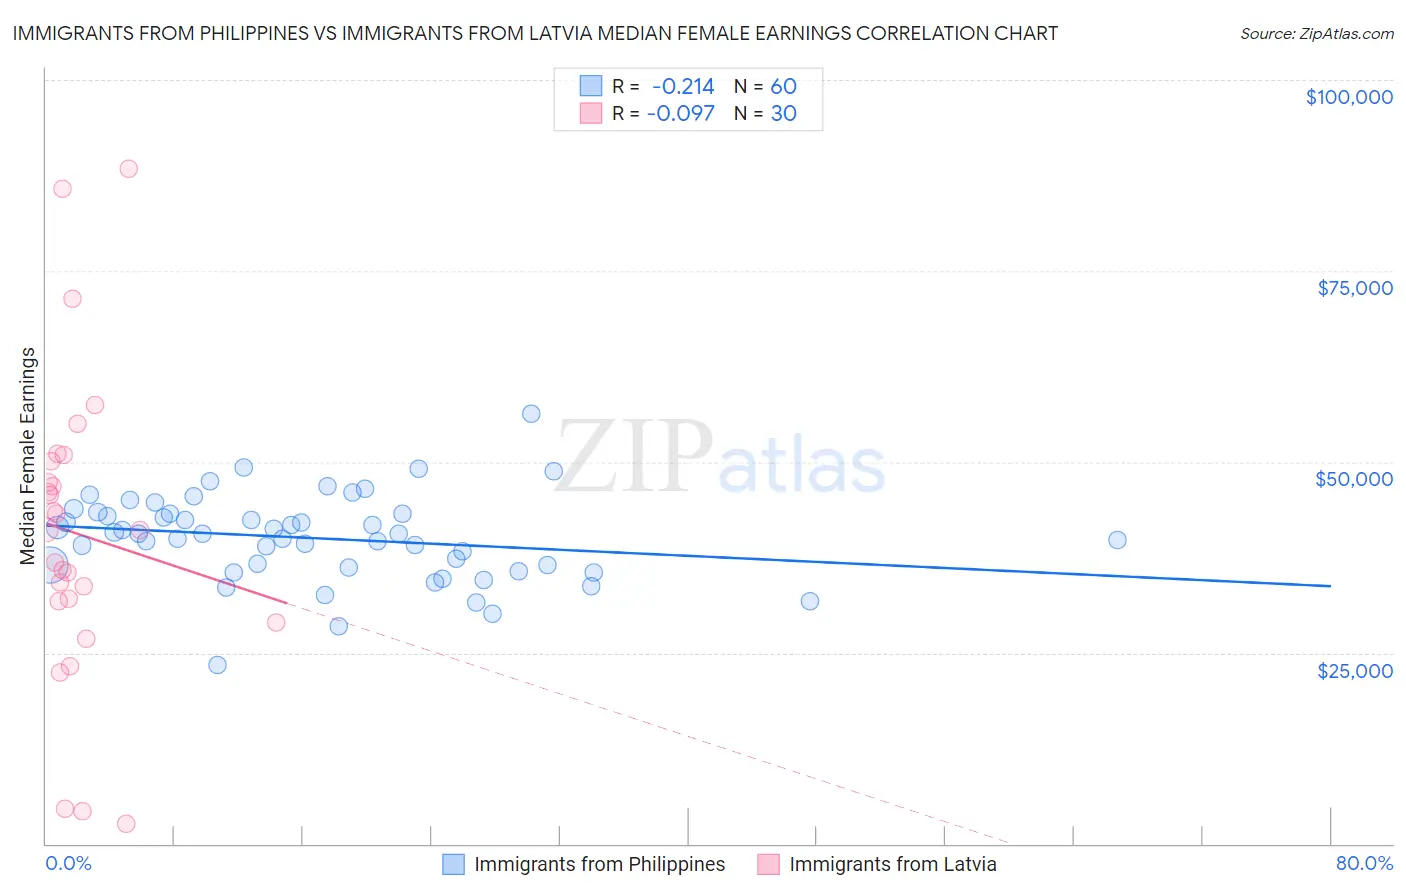
Immigrants from Philippines vs Immigrants from Latvia Median Female Earnings Correlation Chart

The statistical analysis conducted on geographies consisting of 470,999,138 people shows a weak negative correlation between the proportion of Immigrants from Philippines and median female earnings in the United States with a correlation coefficient (R) of -0.214 and weighted average of $41,114. Similarly, the statistical analysis conducted on geographies consisting of 113,735,642 people shows a slight negative correlation between the proportion of Immigrants from Latvia and median female earnings in the United States with a correlation coefficient (R) of -0.097 and weighted average of $43,099, a difference of 4.8%.
Immigrants from Philippines vs Immigrants from Latvia Median Female Earnings

Median Female Earnings Correlation Summary

MeasurementImmigrants from PhilippinesImmigrants from Latvia
Minimum$23,405$2,606
Maximum$56,354$88,365
Range$32,949$85,759
Mean$40,018$40,583
Median$40,572$41,080
Interquartile 25% (IQ1)$36,304$31,765
Interquartile 75% (IQ3)$43,216$50,109
Interquartile Range (IQR)$6,912$18,344
Standard Deviation (Sample)$5,659$19,932
Standard Deviation (Population)$5,612$19,597

Similar Demographics by Median Female Earnings

Demographics Similar to Immigrants from Philippines by Median Female Earnings

In terms of median female earnings, the demographic groups most similar to Immigrants from Philippines are Immigrants from Kuwait ($41,055, a difference of 0.15%), Immigrants from Lebanon ($41,183, a difference of 0.17%), Croatian ($40,993, a difference of 0.30%), Immigrants from Jordan ($40,977, a difference of 0.33%), and Guyanese ($40,973, a difference of 0.34%).
DemographicsRating | RankMedian Female Earnings
Immigrants | North America
96.7
/100
|
#112
Exceptional
$41,319
Macedonians
96.4
/100
|
#113
Exceptional
$41,286
Immigrants | England
96.4
/100
|
#114
Exceptional
$41,277
Koreans
96.4
/100
|
#115
Exceptional
$41,276
Immigrants | Brazil
96.4
/100
|
#116
Exceptional
$41,273
Barbadians
96.3
/100
|
#117
Exceptional
$41,261
Immigrants | Lebanon
95.6
/100
|
#118
Exceptional
$41,183
Immigrants | Philippines
95.0
/100
|
#119
Exceptional
$41,114
Immigrants | Kuwait
94.4
/100
|
#120
Exceptional
$41,055
Croatians
93.7
/100
|
#121
Exceptional
$40,993
Immigrants | Jordan
93.5
/100
|
#122
Exceptional
$40,977
Guyanese
93.4
/100
|
#123
Exceptional
$40,973
Trinidadians and Tobagonians
93.2
/100
|
#124
Exceptional
$40,958
Austrians
92.7
/100
|
#125
Exceptional
$40,923
Immigrants | Trinidad and Tobago
92.3
/100
|
#126
Exceptional
$40,895

Demographics Similar to Immigrants from Latvia by Median Female Earnings

In terms of median female earnings, the demographic groups most similar to Immigrants from Latvia are Estonian ($43,106, a difference of 0.020%), Immigrants from Bulgaria ($43,085, a difference of 0.030%), Afghan ($43,077, a difference of 0.050%), Immigrants from Ukraine ($43,069, a difference of 0.070%), and Immigrants from Pakistan ($43,052, a difference of 0.11%).
DemographicsRating | RankMedian Female Earnings
Immigrants | Eastern Europe
99.9
/100
|
#53
Exceptional
$43,309
Australians
99.9
/100
|
#54
Exceptional
$43,308
Egyptians
99.9
/100
|
#55
Exceptional
$43,305
Immigrants | Croatia
99.9
/100
|
#56
Exceptional
$43,258
Ethiopians
99.9
/100
|
#57
Exceptional
$43,243
Paraguayans
99.9
/100
|
#58
Exceptional
$43,173
Estonians
99.9
/100
|
#59
Exceptional
$43,106
Immigrants | Latvia
99.9
/100
|
#60
Exceptional
$43,099
Immigrants | Bulgaria
99.9
/100
|
#61
Exceptional
$43,085
Afghans
99.9
/100
|
#62
Exceptional
$43,077
Immigrants | Ukraine
99.9
/100
|
#63
Exceptional
$43,069
Immigrants | Pakistan
99.9
/100
|
#64
Exceptional
$43,052
Sierra Leoneans
99.9
/100
|
#65
Exceptional
$42,868
Immigrants | Norway
99.9
/100
|
#66
Exceptional
$42,837
Immigrants | Egypt
99.9
/100
|
#67
Exceptional
$42,837