Cree vs Immigrants from Latvia Male Poverty
COMPARE
Cree
Immigrants from Latvia
Male Poverty
Male Poverty Comparison
Cree
Immigrants from Latvia
13.3%
MALE POVERTY
0.0/ 100
METRIC RATING
270th/ 347
METRIC RANK
10.5%
MALE POVERTY
92.8/ 100
METRIC RATING
100th/ 347
METRIC RANK
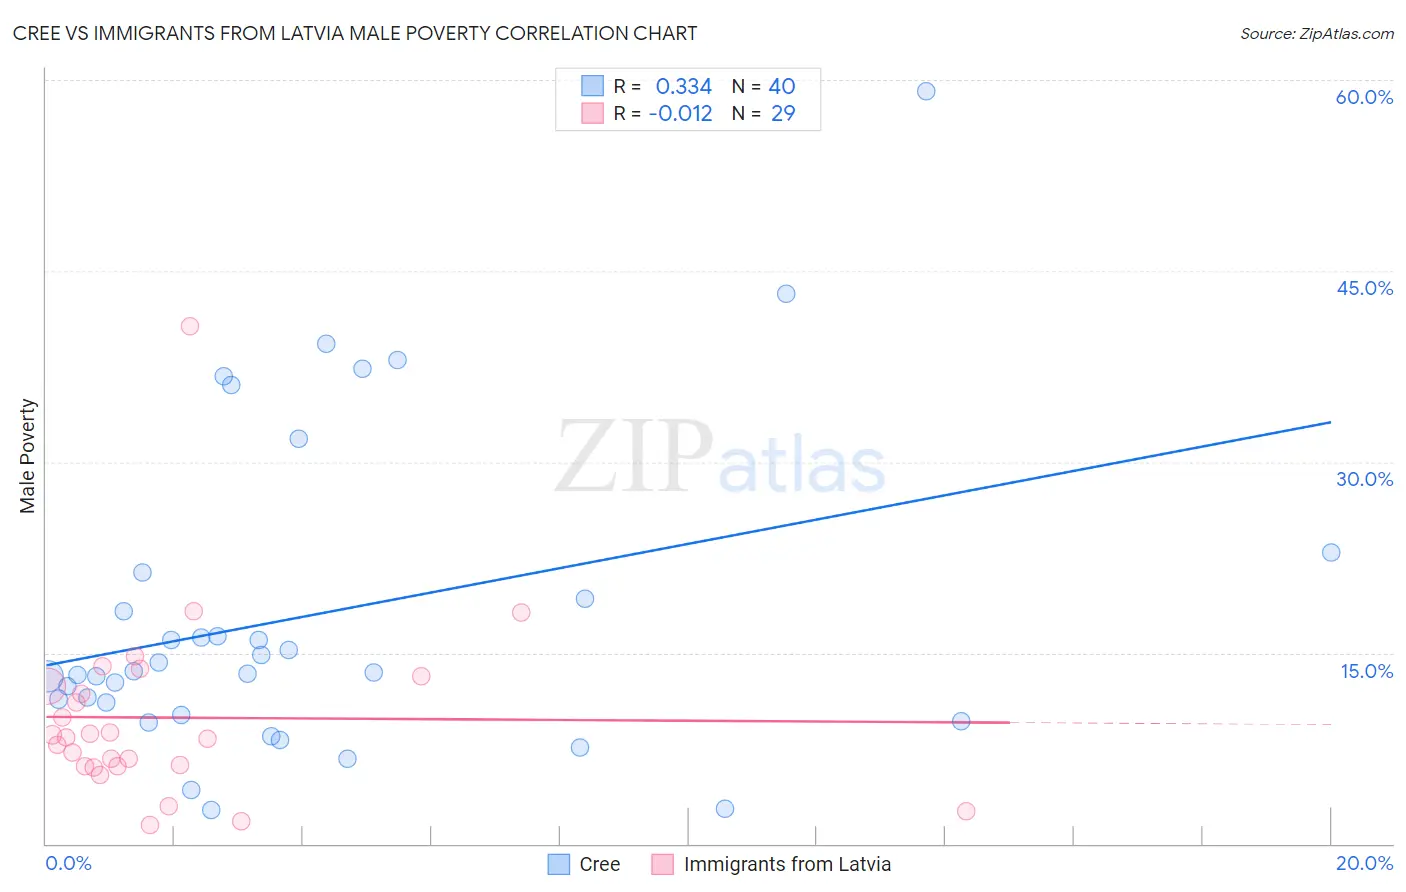
Cree vs Immigrants from Latvia Male Poverty Correlation Chart
The statistical analysis conducted on geographies consisting of 76,204,291 people shows a mild positive correlation between the proportion of Cree and poverty level among males in the United States with a correlation coefficient (R) of 0.334 and weighted average of 13.3%. Similarly, the statistical analysis conducted on geographies consisting of 113,727,577 people shows no correlation between the proportion of Immigrants from Latvia and poverty level among males in the United States with a correlation coefficient (R) of -0.012 and weighted average of 10.5%, a difference of 27.2%.
Male Poverty Correlation Summary
| Measurement | Cree | Immigrants from Latvia |
| Minimum | 2.7% | 1.5% |
| Maximum | 59.1% | 40.7% |
| Range | 56.4% | 39.2% |
| Mean | 18.0% | 9.9% |
| Median | 13.5% | 8.3% |
| Interquartile 25% (IQ1) | 10.6% | 6.1% |
| Interquartile 75% (IQ3) | 20.2% | 12.8% |
| Interquartile Range (IQR) | 9.6% | 6.7% |
| Standard Deviation (Sample) | 12.5% | 7.4% |
| Standard Deviation (Population) | 12.4% | 7.2% |
Similar Demographics by Male Poverty
Demographics Similar to Cree by Male Poverty
In terms of male poverty, the demographic groups most similar to Cree are Spanish American (13.4%, a difference of 0.030%), Guyanese (13.3%, a difference of 0.47%), Subsaharan African (13.3%, a difference of 0.69%), Immigrants from Jamaica (13.3%, a difference of 0.72%), and Immigrants from Bahamas (13.5%, a difference of 0.78%).
| Demographics | Rating | Rank | Male Poverty |
| Central Americans | 0.1 /100 | #263 | Tragic 13.2% |
| Iroquois | 0.1 /100 | #264 | Tragic 13.2% |
| Jamaicans | 0.1 /100 | #265 | Tragic 13.2% |
| Immigrants | Guyana | 0.1 /100 | #266 | Tragic 13.2% |
| Immigrants | Jamaica | 0.1 /100 | #267 | Tragic 13.3% |
| Sub-Saharan Africans | 0.1 /100 | #268 | Tragic 13.3% |
| Guyanese | 0.0 /100 | #269 | Tragic 13.3% |
| Cree | 0.0 /100 | #270 | Tragic 13.3% |
| Spanish Americans | 0.0 /100 | #271 | Tragic 13.4% |
| Immigrants | Bahamas | 0.0 /100 | #272 | Tragic 13.5% |
| Chickasaw | 0.0 /100 | #273 | Tragic 13.5% |
| Immigrants | West Indies | 0.0 /100 | #274 | Tragic 13.5% |
| Barbadians | 0.0 /100 | #275 | Tragic 13.6% |
| Immigrants | Latin America | 0.0 /100 | #276 | Tragic 13.6% |
| Bangladeshis | 0.0 /100 | #277 | Tragic 13.6% |
Demographics Similar to Immigrants from Latvia by Male Poverty
In terms of male poverty, the demographic groups most similar to Immigrants from Latvia are Immigrants from Indonesia (10.5%, a difference of 0.21%), Finnish (10.5%, a difference of 0.28%), Immigrants from Zimbabwe (10.5%, a difference of 0.29%), French Canadian (10.5%, a difference of 0.30%), and Romanian (10.5%, a difference of 0.34%).
| Demographics | Rating | Rank | Male Poverty |
| Australians | 94.4 /100 | #93 | Exceptional 10.4% |
| Immigrants | South Africa | 94.1 /100 | #94 | Exceptional 10.4% |
| Scottish | 94.0 /100 | #95 | Exceptional 10.4% |
| Immigrants | Egypt | 93.7 /100 | #96 | Exceptional 10.4% |
| Romanians | 93.6 /100 | #97 | Exceptional 10.5% |
| Finns | 93.4 /100 | #98 | Exceptional 10.5% |
| Immigrants | Indonesia | 93.3 /100 | #99 | Exceptional 10.5% |
| Immigrants | Latvia | 92.8 /100 | #100 | Exceptional 10.5% |
| Immigrants | Zimbabwe | 92.0 /100 | #101 | Exceptional 10.5% |
| French Canadians | 91.9 /100 | #102 | Exceptional 10.5% |
| Slavs | 91.7 /100 | #103 | Exceptional 10.5% |
| Welsh | 91.6 /100 | #104 | Exceptional 10.5% |
| Canadians | 91.6 /100 | #105 | Exceptional 10.5% |
| Immigrants | Southern Europe | 91.3 /100 | #106 | Exceptional 10.5% |
| Laotians | 91.2 /100 | #107 | Exceptional 10.5% |