Comanche vs Immigrants from Zimbabwe Median Earnings
COMPARE
Comanche
Immigrants from Zimbabwe
Median Earnings
Median Earnings Comparison
Comanche
Immigrants from Zimbabwe
$41,519
MEDIAN EARNINGS
0.1/ 100
METRIC RATING
289th/ 347
METRIC RANK
$48,913
MEDIAN EARNINGS
97.0/ 100
METRIC RATING
111th/ 347
METRIC RANK
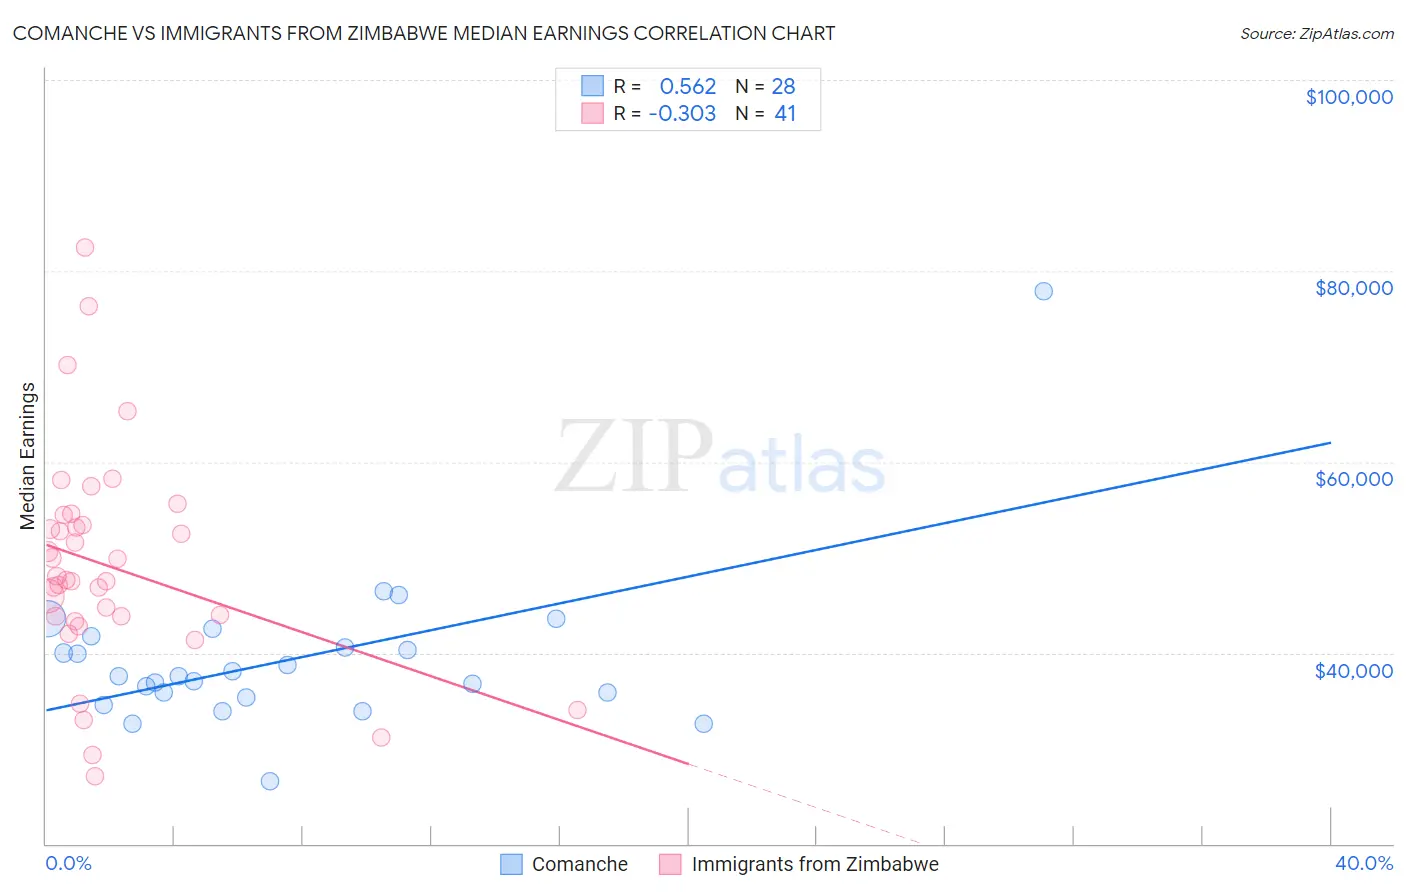
Comanche vs Immigrants from Zimbabwe Median Earnings Correlation Chart
The statistical analysis conducted on geographies consisting of 109,778,903 people shows a substantial positive correlation between the proportion of Comanche and median earnings in the United States with a correlation coefficient (R) of 0.562 and weighted average of $41,519. Similarly, the statistical analysis conducted on geographies consisting of 117,811,113 people shows a mild negative correlation between the proportion of Immigrants from Zimbabwe and median earnings in the United States with a correlation coefficient (R) of -0.303 and weighted average of $48,913, a difference of 17.8%.
Median Earnings Correlation Summary
| Measurement | Comanche | Immigrants from Zimbabwe |
| Minimum | $26,595 | $27,083 |
| Maximum | $77,937 | $82,500 |
| Range | $51,342 | $55,417 |
| Mean | $39,371 | $49,057 |
| Median | $37,513 | $47,680 |
| Interquartile 25% (IQ1) | $35,556 | $43,542 |
| Interquartile 75% (IQ3) | $41,131 | $53,907 |
| Interquartile Range (IQR) | $5,575 | $10,364 |
| Standard Deviation (Sample) | $8,724 | $11,395 |
| Standard Deviation (Population) | $8,566 | $11,255 |
Similar Demographics by Median Earnings
Demographics Similar to Comanche by Median Earnings
In terms of median earnings, the demographic groups most similar to Comanche are Paiute ($41,508, a difference of 0.030%), Immigrants from Dominican Republic ($41,554, a difference of 0.080%), Central American Indian ($41,474, a difference of 0.11%), U.S. Virgin Islander ($41,448, a difference of 0.17%), and Indonesian ($41,701, a difference of 0.44%).
| Demographics | Rating | Rank | Median Earnings |
| Africans | 0.2 /100 | #282 | Tragic $41,955 |
| Dominicans | 0.2 /100 | #283 | Tragic $41,864 |
| Blackfeet | 0.2 /100 | #284 | Tragic $41,822 |
| Immigrants | Nicaragua | 0.1 /100 | #285 | Tragic $41,737 |
| Mexican American Indians | 0.1 /100 | #286 | Tragic $41,719 |
| Indonesians | 0.1 /100 | #287 | Tragic $41,701 |
| Immigrants | Dominican Republic | 0.1 /100 | #288 | Tragic $41,554 |
| Comanche | 0.1 /100 | #289 | Tragic $41,519 |
| Paiute | 0.1 /100 | #290 | Tragic $41,508 |
| Central American Indians | 0.1 /100 | #291 | Tragic $41,474 |
| U.S. Virgin Islanders | 0.1 /100 | #292 | Tragic $41,448 |
| Immigrants | Zaire | 0.1 /100 | #293 | Tragic $41,325 |
| Potawatomi | 0.1 /100 | #294 | Tragic $41,288 |
| Bangladeshis | 0.1 /100 | #295 | Tragic $41,263 |
| Cherokee | 0.1 /100 | #296 | Tragic $41,252 |
Demographics Similar to Immigrants from Zimbabwe by Median Earnings
In terms of median earnings, the demographic groups most similar to Immigrants from Zimbabwe are Immigrants from Ethiopia ($48,924, a difference of 0.020%), Syrian ($48,934, a difference of 0.040%), Northern European ($48,887, a difference of 0.050%), Immigrants from Kuwait ($48,861, a difference of 0.11%), and Moroccan ($48,838, a difference of 0.15%).
| Demographics | Rating | Rank | Median Earnings |
| Immigrants | Brazil | 98.6 /100 | #104 | Exceptional $49,463 |
| Immigrants | Western Asia | 98.4 /100 | #105 | Exceptional $49,389 |
| Immigrants | Albania | 98.4 /100 | #106 | Exceptional $49,377 |
| Immigrants | Morocco | 98.4 /100 | #107 | Exceptional $49,368 |
| Palestinians | 98.0 /100 | #108 | Exceptional $49,209 |
| Syrians | 97.1 /100 | #109 | Exceptional $48,934 |
| Immigrants | Ethiopia | 97.1 /100 | #110 | Exceptional $48,924 |
| Immigrants | Zimbabwe | 97.0 /100 | #111 | Exceptional $48,913 |
| Northern Europeans | 96.9 /100 | #112 | Exceptional $48,887 |
| Immigrants | Kuwait | 96.8 /100 | #113 | Exceptional $48,861 |
| Moroccans | 96.7 /100 | #114 | Exceptional $48,838 |
| Chinese | 96.7 /100 | #115 | Exceptional $48,836 |
| Koreans | 96.2 /100 | #116 | Exceptional $48,727 |
| Serbians | 95.9 /100 | #117 | Exceptional $48,677 |
| Immigrants | Jordan | 95.9 /100 | #118 | Exceptional $48,673 |