Hawaiian vs Immigrants from Zimbabwe Median Earnings
COMPARE
Hawaiian
Immigrants from Zimbabwe
Median Earnings
Median Earnings Comparison
Hawaiians
Immigrants from Zimbabwe
$43,673
MEDIAN EARNINGS
2.0/ 100
METRIC RATING
252nd/ 347
METRIC RANK
$48,913
MEDIAN EARNINGS
97.0/ 100
METRIC RATING
111th/ 347
METRIC RANK
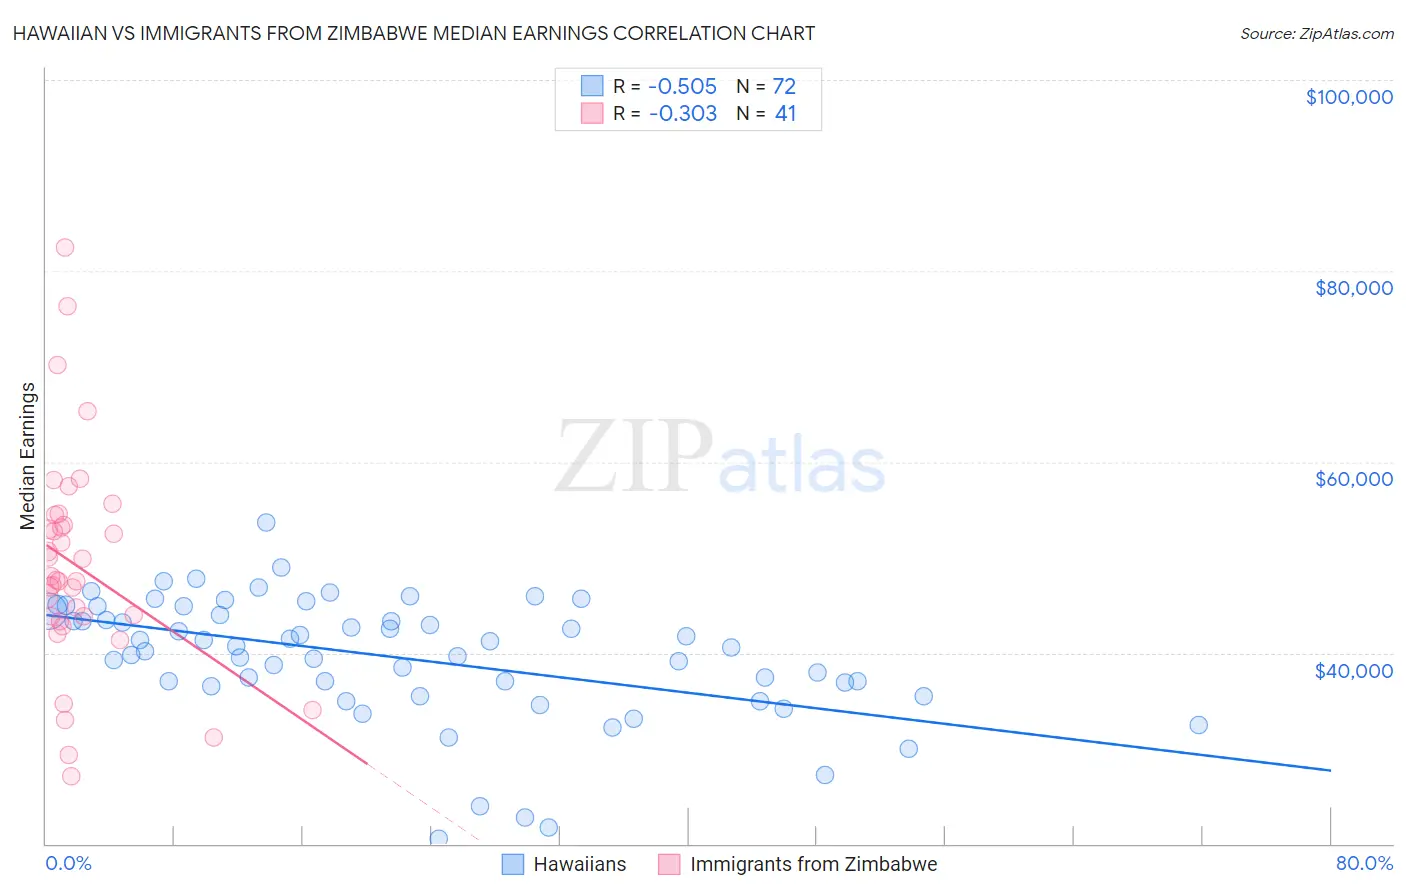
Hawaiian vs Immigrants from Zimbabwe Median Earnings Correlation Chart
The statistical analysis conducted on geographies consisting of 327,597,222 people shows a substantial negative correlation between the proportion of Hawaiians and median earnings in the United States with a correlation coefficient (R) of -0.505 and weighted average of $43,673. Similarly, the statistical analysis conducted on geographies consisting of 117,811,113 people shows a mild negative correlation between the proportion of Immigrants from Zimbabwe and median earnings in the United States with a correlation coefficient (R) of -0.303 and weighted average of $48,913, a difference of 12.0%.
Median Earnings Correlation Summary
| Measurement | Hawaiian | Immigrants from Zimbabwe |
| Minimum | $20,530 | $27,083 |
| Maximum | $53,613 | $82,500 |
| Range | $33,083 | $55,417 |
| Mean | $39,525 | $49,057 |
| Median | $40,637 | $47,680 |
| Interquartile 25% (IQ1) | $36,694 | $43,542 |
| Interquartile 75% (IQ3) | $44,126 | $53,907 |
| Interquartile Range (IQR) | $7,432 | $10,364 |
| Standard Deviation (Sample) | $6,473 | $11,395 |
| Standard Deviation (Population) | $6,428 | $11,255 |
Similar Demographics by Median Earnings
Demographics Similar to Hawaiians by Median Earnings
In terms of median earnings, the demographic groups most similar to Hawaiians are Tsimshian ($43,695, a difference of 0.050%), Alaska Native ($43,750, a difference of 0.18%), Somali ($43,567, a difference of 0.24%), Liberian ($43,536, a difference of 0.31%), and Malaysian ($43,844, a difference of 0.39%).
| Demographics | Rating | Rank | Median Earnings |
| Immigrants | Burma/Myanmar | 3.2 /100 | #245 | Tragic $43,998 |
| Immigrants | West Indies | 3.1 /100 | #246 | Tragic $43,989 |
| Immigrants | Cabo Verde | 3.0 /100 | #247 | Tragic $43,963 |
| Nepalese | 2.6 /100 | #248 | Tragic $43,860 |
| Malaysians | 2.6 /100 | #249 | Tragic $43,844 |
| Alaska Natives | 2.3 /100 | #250 | Tragic $43,750 |
| Tsimshian | 2.1 /100 | #251 | Tragic $43,695 |
| Hawaiians | 2.0 /100 | #252 | Tragic $43,673 |
| Somalis | 1.8 /100 | #253 | Tragic $43,567 |
| Liberians | 1.7 /100 | #254 | Tragic $43,536 |
| Immigrants | Middle Africa | 1.4 /100 | #255 | Tragic $43,416 |
| Alaskan Athabascans | 1.4 /100 | #256 | Tragic $43,393 |
| Jamaicans | 1.3 /100 | #257 | Tragic $43,343 |
| French American Indians | 1.3 /100 | #258 | Tragic $43,333 |
| German Russians | 1.1 /100 | #259 | Tragic $43,200 |
Demographics Similar to Immigrants from Zimbabwe by Median Earnings
In terms of median earnings, the demographic groups most similar to Immigrants from Zimbabwe are Immigrants from Ethiopia ($48,924, a difference of 0.020%), Syrian ($48,934, a difference of 0.040%), Northern European ($48,887, a difference of 0.050%), Immigrants from Kuwait ($48,861, a difference of 0.11%), and Moroccan ($48,838, a difference of 0.15%).
| Demographics | Rating | Rank | Median Earnings |
| Immigrants | Brazil | 98.6 /100 | #104 | Exceptional $49,463 |
| Immigrants | Western Asia | 98.4 /100 | #105 | Exceptional $49,389 |
| Immigrants | Albania | 98.4 /100 | #106 | Exceptional $49,377 |
| Immigrants | Morocco | 98.4 /100 | #107 | Exceptional $49,368 |
| Palestinians | 98.0 /100 | #108 | Exceptional $49,209 |
| Syrians | 97.1 /100 | #109 | Exceptional $48,934 |
| Immigrants | Ethiopia | 97.1 /100 | #110 | Exceptional $48,924 |
| Immigrants | Zimbabwe | 97.0 /100 | #111 | Exceptional $48,913 |
| Northern Europeans | 96.9 /100 | #112 | Exceptional $48,887 |
| Immigrants | Kuwait | 96.8 /100 | #113 | Exceptional $48,861 |
| Moroccans | 96.7 /100 | #114 | Exceptional $48,838 |
| Chinese | 96.7 /100 | #115 | Exceptional $48,836 |
| Koreans | 96.2 /100 | #116 | Exceptional $48,727 |
| Serbians | 95.9 /100 | #117 | Exceptional $48,677 |
| Immigrants | Jordan | 95.9 /100 | #118 | Exceptional $48,673 |