Comanche vs Immigrants from Zimbabwe 11th Grade
COMPARE
Comanche
Immigrants from Zimbabwe
11th Grade
11th Grade Comparison
Comanche
Immigrants from Zimbabwe
91.7%
11TH GRADE
2.6/ 100
METRIC RATING
238th/ 347
METRIC RANK
93.4%
11TH GRADE
97.8/ 100
METRIC RATING
113th/ 347
METRIC RANK
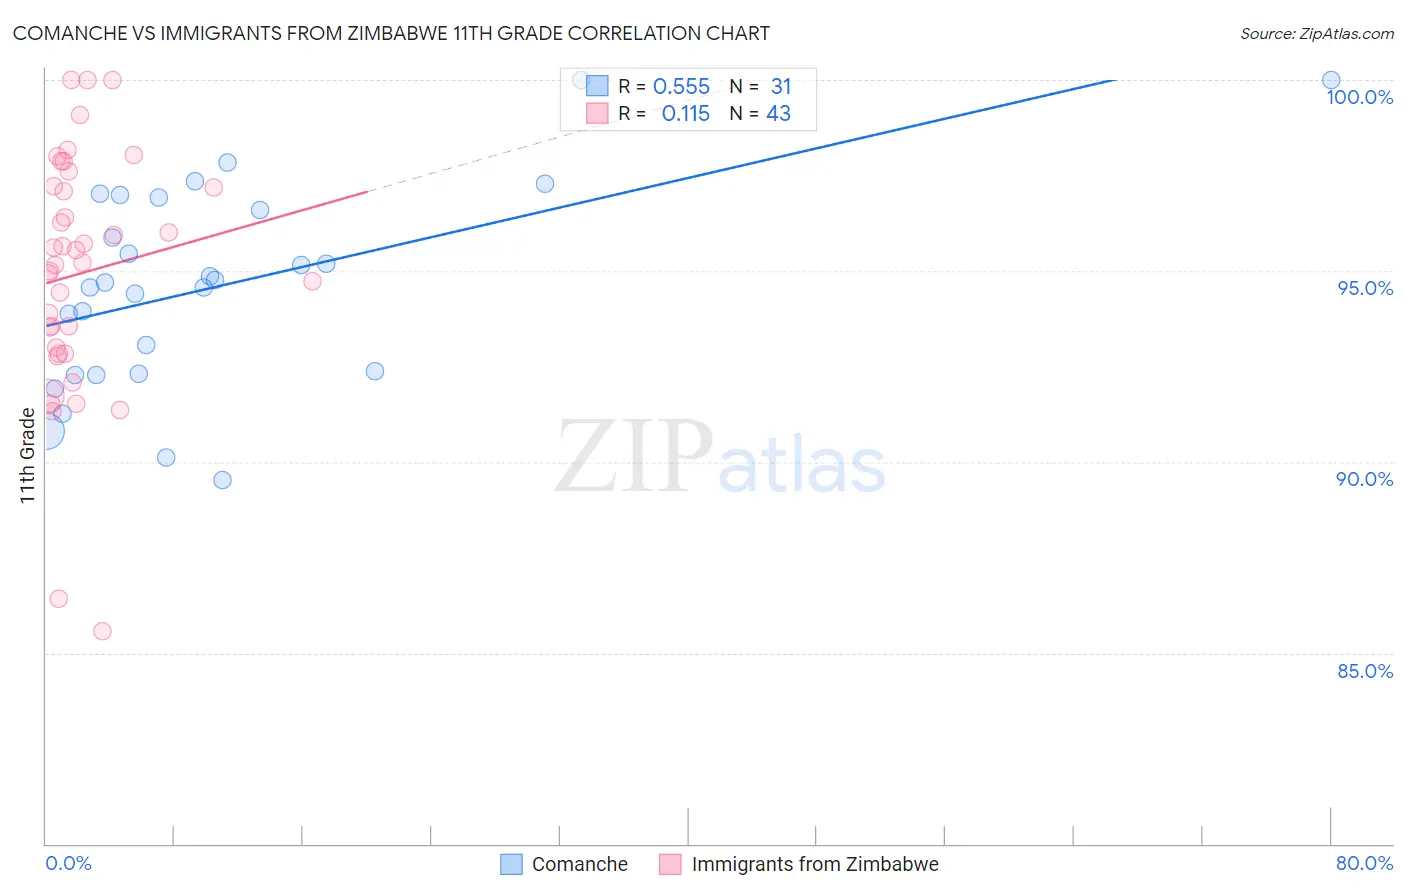
Comanche vs Immigrants from Zimbabwe 11th Grade Correlation Chart
The statistical analysis conducted on geographies consisting of 109,786,530 people shows a substantial positive correlation between the proportion of Comanche and percentage of population with at least 11th grade education in the United States with a correlation coefficient (R) of 0.555 and weighted average of 91.7%. Similarly, the statistical analysis conducted on geographies consisting of 117,809,656 people shows a poor positive correlation between the proportion of Immigrants from Zimbabwe and percentage of population with at least 11th grade education in the United States with a correlation coefficient (R) of 0.115 and weighted average of 93.4%, a difference of 1.8%.
11th Grade Correlation Summary
| Measurement | Comanche | Immigrants from Zimbabwe |
| Minimum | 89.5% | 85.5% |
| Maximum | 100.0% | 100.0% |
| Range | 10.5% | 14.5% |
| Mean | 94.6% | 94.9% |
| Median | 94.7% | 95.2% |
| Interquartile 25% (IQ1) | 92.3% | 92.8% |
| Interquartile 75% (IQ3) | 96.9% | 97.2% |
| Interquartile Range (IQR) | 4.6% | 4.4% |
| Standard Deviation (Sample) | 2.6% | 3.2% |
| Standard Deviation (Population) | 2.6% | 3.1% |
Similar Demographics by 11th Grade
Demographics Similar to Comanche by 11th Grade
In terms of 11th grade, the demographic groups most similar to Comanche are Hopi (91.7%, a difference of 0.0%), Colombian (91.7%, a difference of 0.020%), Immigrants from Bolivia (91.7%, a difference of 0.020%), Armenian (91.7%, a difference of 0.030%), and Subsaharan African (91.7%, a difference of 0.030%).
| Demographics | Rating | Rank | 11th Grade |
| Choctaw | 3.7 /100 | #231 | Tragic 91.8% |
| Uruguayans | 3.5 /100 | #232 | Tragic 91.8% |
| Cheyenne | 3.3 /100 | #233 | Tragic 91.8% |
| Armenians | 2.9 /100 | #234 | Tragic 91.7% |
| Sub-Saharan Africans | 2.9 /100 | #235 | Tragic 91.7% |
| Colombians | 2.8 /100 | #236 | Tragic 91.7% |
| Immigrants | Bolivia | 2.8 /100 | #237 | Tragic 91.7% |
| Comanche | 2.6 /100 | #238 | Tragic 91.7% |
| Hopi | 2.5 /100 | #239 | Tragic 91.7% |
| South Americans | 2.0 /100 | #240 | Tragic 91.6% |
| Bahamians | 1.8 /100 | #241 | Tragic 91.6% |
| Immigrants | Middle Africa | 1.6 /100 | #242 | Tragic 91.6% |
| Immigrants | Thailand | 1.4 /100 | #243 | Tragic 91.6% |
| Senegalese | 1.4 /100 | #244 | Tragic 91.6% |
| Africans | 1.3 /100 | #245 | Tragic 91.5% |
Demographics Similar to Immigrants from Zimbabwe by 11th Grade
In terms of 11th grade, the demographic groups most similar to Immigrants from Zimbabwe are Jordanian (93.4%, a difference of 0.0%), Palestinian (93.4%, a difference of 0.020%), Yugoslavian (93.4%, a difference of 0.030%), Immigrants from Germany (93.4%, a difference of 0.030%), and Immigrants from Hungary (93.4%, a difference of 0.030%).
| Demographics | Rating | Rank | 11th Grade |
| Immigrants | Croatia | 98.6 /100 | #106 | Exceptional 93.5% |
| Immigrants | Norway | 98.4 /100 | #107 | Exceptional 93.5% |
| Alaska Natives | 98.4 /100 | #108 | Exceptional 93.5% |
| Immigrants | Kuwait | 98.4 /100 | #109 | Exceptional 93.5% |
| Syrians | 98.4 /100 | #110 | Exceptional 93.4% |
| Yugoslavians | 98.1 /100 | #111 | Exceptional 93.4% |
| Immigrants | Germany | 98.0 /100 | #112 | Exceptional 93.4% |
| Immigrants | Zimbabwe | 97.8 /100 | #113 | Exceptional 93.4% |
| Jordanians | 97.8 /100 | #114 | Exceptional 93.4% |
| Palestinians | 97.7 /100 | #115 | Exceptional 93.4% |
| Immigrants | Hungary | 97.5 /100 | #116 | Exceptional 93.4% |
| Whites/Caucasians | 97.4 /100 | #117 | Exceptional 93.3% |
| Immigrants | Korea | 97.0 /100 | #118 | Exceptional 93.3% |
| Israelis | 97.0 /100 | #119 | Exceptional 93.3% |
| Immigrants | Russia | 96.6 /100 | #120 | Exceptional 93.3% |