Romanian vs Immigrants from Zimbabwe Median Earnings
COMPARE
Romanian
Immigrants from Zimbabwe
Median Earnings
Median Earnings Comparison
Romanians
Immigrants from Zimbabwe
$50,244
MEDIAN EARNINGS
99.5/ 100
METRIC RATING
83rd/ 347
METRIC RANK
$48,913
MEDIAN EARNINGS
97.0/ 100
METRIC RATING
111th/ 347
METRIC RANK
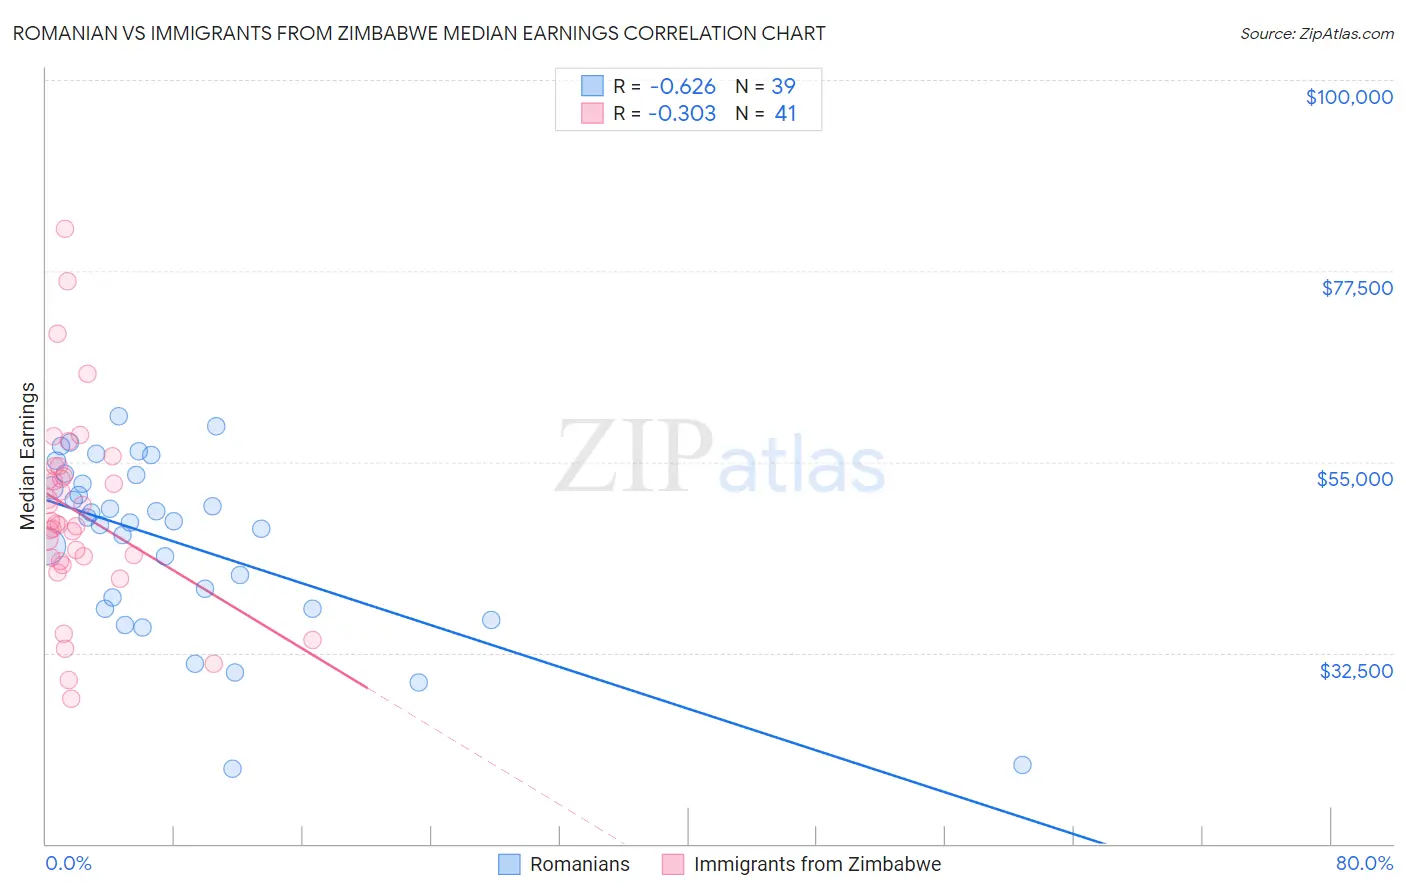
Romanian vs Immigrants from Zimbabwe Median Earnings Correlation Chart
The statistical analysis conducted on geographies consisting of 377,906,078 people shows a significant negative correlation between the proportion of Romanians and median earnings in the United States with a correlation coefficient (R) of -0.626 and weighted average of $50,244. Similarly, the statistical analysis conducted on geographies consisting of 117,811,113 people shows a mild negative correlation between the proportion of Immigrants from Zimbabwe and median earnings in the United States with a correlation coefficient (R) of -0.303 and weighted average of $48,913, a difference of 2.7%.
Median Earnings Correlation Summary
| Measurement | Romanian | Immigrants from Zimbabwe |
| Minimum | $18,814 | $27,083 |
| Maximum | $60,367 | $82,500 |
| Range | $41,553 | $55,417 |
| Mean | $45,500 | $49,057 |
| Median | $48,068 | $47,680 |
| Interquartile 25% (IQ1) | $37,750 | $43,542 |
| Interquartile 75% (IQ3) | $53,505 | $53,907 |
| Interquartile Range (IQR) | $15,755 | $10,364 |
| Standard Deviation (Sample) | $10,336 | $11,395 |
| Standard Deviation (Population) | $10,203 | $11,255 |
Similar Demographics by Median Earnings
Demographics Similar to Romanians by Median Earnings
In terms of median earnings, the demographic groups most similar to Romanians are Immigrants from Hungary ($50,227, a difference of 0.030%), Immigrants from Kazakhstan ($50,225, a difference of 0.040%), Immigrants from Moldova ($50,274, a difference of 0.060%), Immigrants from Southern Europe ($50,280, a difference of 0.070%), and Immigrants from Canada ($50,192, a difference of 0.10%).
| Demographics | Rating | Rank | Median Earnings |
| Immigrants | Italy | 99.7 /100 | #76 | Exceptional $50,581 |
| Immigrants | Western Europe | 99.7 /100 | #77 | Exceptional $50,549 |
| Argentineans | 99.6 /100 | #78 | Exceptional $50,399 |
| Laotians | 99.6 /100 | #79 | Exceptional $50,343 |
| Ukrainians | 99.6 /100 | #80 | Exceptional $50,320 |
| Immigrants | Southern Europe | 99.6 /100 | #81 | Exceptional $50,280 |
| Immigrants | Moldova | 99.5 /100 | #82 | Exceptional $50,274 |
| Romanians | 99.5 /100 | #83 | Exceptional $50,244 |
| Immigrants | Hungary | 99.5 /100 | #84 | Exceptional $50,227 |
| Immigrants | Kazakhstan | 99.5 /100 | #85 | Exceptional $50,225 |
| Immigrants | Canada | 99.5 /100 | #86 | Exceptional $50,192 |
| Immigrants | Uzbekistan | 99.5 /100 | #87 | Exceptional $50,151 |
| Albanians | 99.4 /100 | #88 | Exceptional $50,116 |
| Immigrants | North America | 99.4 /100 | #89 | Exceptional $50,108 |
| Italians | 99.3 /100 | #90 | Exceptional $49,915 |
Demographics Similar to Immigrants from Zimbabwe by Median Earnings
In terms of median earnings, the demographic groups most similar to Immigrants from Zimbabwe are Immigrants from Ethiopia ($48,924, a difference of 0.020%), Syrian ($48,934, a difference of 0.040%), Northern European ($48,887, a difference of 0.050%), Immigrants from Kuwait ($48,861, a difference of 0.11%), and Moroccan ($48,838, a difference of 0.15%).
| Demographics | Rating | Rank | Median Earnings |
| Immigrants | Brazil | 98.6 /100 | #104 | Exceptional $49,463 |
| Immigrants | Western Asia | 98.4 /100 | #105 | Exceptional $49,389 |
| Immigrants | Albania | 98.4 /100 | #106 | Exceptional $49,377 |
| Immigrants | Morocco | 98.4 /100 | #107 | Exceptional $49,368 |
| Palestinians | 98.0 /100 | #108 | Exceptional $49,209 |
| Syrians | 97.1 /100 | #109 | Exceptional $48,934 |
| Immigrants | Ethiopia | 97.1 /100 | #110 | Exceptional $48,924 |
| Immigrants | Zimbabwe | 97.0 /100 | #111 | Exceptional $48,913 |
| Northern Europeans | 96.9 /100 | #112 | Exceptional $48,887 |
| Immigrants | Kuwait | 96.8 /100 | #113 | Exceptional $48,861 |
| Moroccans | 96.7 /100 | #114 | Exceptional $48,838 |
| Chinese | 96.7 /100 | #115 | Exceptional $48,836 |
| Koreans | 96.2 /100 | #116 | Exceptional $48,727 |
| Serbians | 95.9 /100 | #117 | Exceptional $48,677 |
| Immigrants | Jordan | 95.9 /100 | #118 | Exceptional $48,673 |