Comanche vs Immigrants from Bolivia Median Earnings
COMPARE
Comanche
Immigrants from Bolivia
Median Earnings
Median Earnings Comparison
Comanche
Immigrants from Bolivia
$41,519
MEDIAN EARNINGS
0.1/ 100
METRIC RATING
289th/ 347
METRIC RANK
$51,605
MEDIAN EARNINGS
99.9/ 100
METRIC RATING
58th/ 347
METRIC RANK
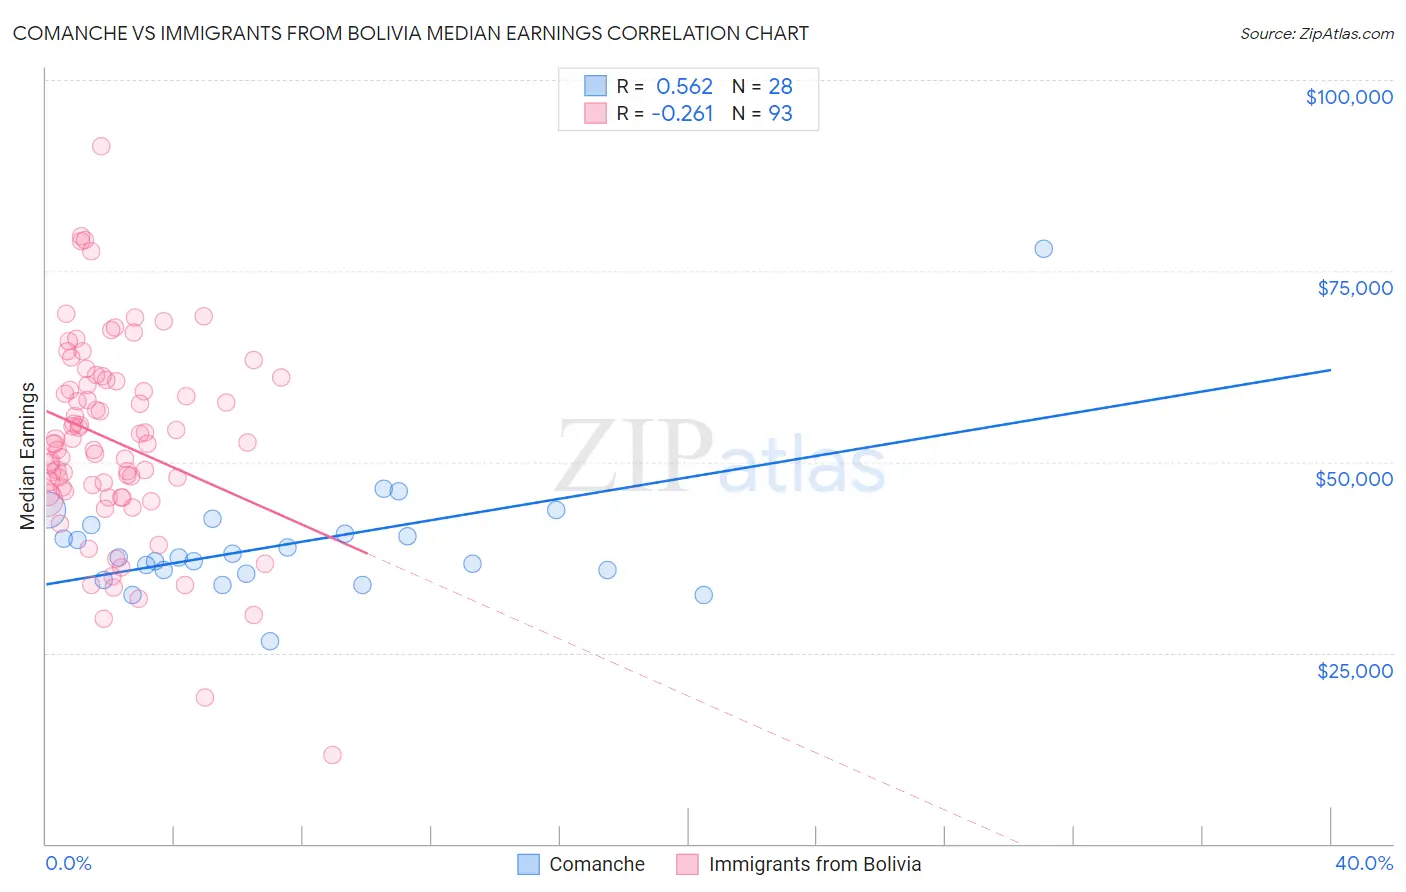
Comanche vs Immigrants from Bolivia Median Earnings Correlation Chart
The statistical analysis conducted on geographies consisting of 109,778,903 people shows a substantial positive correlation between the proportion of Comanche and median earnings in the United States with a correlation coefficient (R) of 0.562 and weighted average of $41,519. Similarly, the statistical analysis conducted on geographies consisting of 158,712,094 people shows a weak negative correlation between the proportion of Immigrants from Bolivia and median earnings in the United States with a correlation coefficient (R) of -0.261 and weighted average of $51,605, a difference of 24.3%.
Median Earnings Correlation Summary
| Measurement | Comanche | Immigrants from Bolivia |
| Minimum | $26,595 | $11,650 |
| Maximum | $77,937 | $91,262 |
| Range | $51,342 | $79,612 |
| Mean | $39,371 | $52,755 |
| Median | $37,513 | $52,407 |
| Interquartile 25% (IQ1) | $35,556 | $46,026 |
| Interquartile 75% (IQ3) | $41,131 | $60,689 |
| Interquartile Range (IQR) | $5,575 | $14,663 |
| Standard Deviation (Sample) | $8,724 | $12,931 |
| Standard Deviation (Population) | $8,566 | $12,861 |
Similar Demographics by Median Earnings
Demographics Similar to Comanche by Median Earnings
In terms of median earnings, the demographic groups most similar to Comanche are Paiute ($41,508, a difference of 0.030%), Immigrants from Dominican Republic ($41,554, a difference of 0.080%), Central American Indian ($41,474, a difference of 0.11%), U.S. Virgin Islander ($41,448, a difference of 0.17%), and Indonesian ($41,701, a difference of 0.44%).
| Demographics | Rating | Rank | Median Earnings |
| Africans | 0.2 /100 | #282 | Tragic $41,955 |
| Dominicans | 0.2 /100 | #283 | Tragic $41,864 |
| Blackfeet | 0.2 /100 | #284 | Tragic $41,822 |
| Immigrants | Nicaragua | 0.1 /100 | #285 | Tragic $41,737 |
| Mexican American Indians | 0.1 /100 | #286 | Tragic $41,719 |
| Indonesians | 0.1 /100 | #287 | Tragic $41,701 |
| Immigrants | Dominican Republic | 0.1 /100 | #288 | Tragic $41,554 |
| Comanche | 0.1 /100 | #289 | Tragic $41,519 |
| Paiute | 0.1 /100 | #290 | Tragic $41,508 |
| Central American Indians | 0.1 /100 | #291 | Tragic $41,474 |
| U.S. Virgin Islanders | 0.1 /100 | #292 | Tragic $41,448 |
| Immigrants | Zaire | 0.1 /100 | #293 | Tragic $41,325 |
| Potawatomi | 0.1 /100 | #294 | Tragic $41,288 |
| Bangladeshis | 0.1 /100 | #295 | Tragic $41,263 |
| Cherokee | 0.1 /100 | #296 | Tragic $41,252 |
Demographics Similar to Immigrants from Bolivia by Median Earnings
In terms of median earnings, the demographic groups most similar to Immigrants from Bolivia are Immigrants from Eastern Europe ($51,624, a difference of 0.040%), Immigrants from Croatia ($51,581, a difference of 0.050%), Immigrants from Serbia ($51,557, a difference of 0.090%), Immigrants from Latvia ($51,555, a difference of 0.10%), and Immigrants from Pakistan ($51,693, a difference of 0.17%).
| Demographics | Rating | Rank | Median Earnings |
| Immigrants | Austria | 99.9 /100 | #51 | Exceptional $51,826 |
| Estonians | 99.9 /100 | #52 | Exceptional $51,772 |
| Immigrants | Norway | 99.9 /100 | #53 | Exceptional $51,758 |
| Immigrants | Indonesia | 99.9 /100 | #54 | Exceptional $51,715 |
| Egyptians | 99.9 /100 | #55 | Exceptional $51,701 |
| Immigrants | Pakistan | 99.9 /100 | #56 | Exceptional $51,693 |
| Immigrants | Eastern Europe | 99.9 /100 | #57 | Exceptional $51,624 |
| Immigrants | Bolivia | 99.9 /100 | #58 | Exceptional $51,605 |
| Immigrants | Croatia | 99.9 /100 | #59 | Exceptional $51,581 |
| Immigrants | Serbia | 99.9 /100 | #60 | Exceptional $51,557 |
| Immigrants | Latvia | 99.9 /100 | #61 | Exceptional $51,555 |
| Immigrants | Romania | 99.9 /100 | #62 | Exceptional $51,337 |
| Immigrants | Bulgaria | 99.9 /100 | #63 | Exceptional $51,318 |
| New Zealanders | 99.9 /100 | #64 | Exceptional $51,246 |
| Greeks | 99.9 /100 | #65 | Exceptional $51,164 |