Comanche vs Immigrants from Nigeria Median Earnings
COMPARE
Comanche
Immigrants from Nigeria
Median Earnings
Median Earnings Comparison
Comanche
Immigrants from Nigeria
$41,519
MEDIAN EARNINGS
0.1/ 100
METRIC RATING
289th/ 347
METRIC RANK
$45,030
MEDIAN EARNINGS
12.2/ 100
METRIC RATING
226th/ 347
METRIC RANK
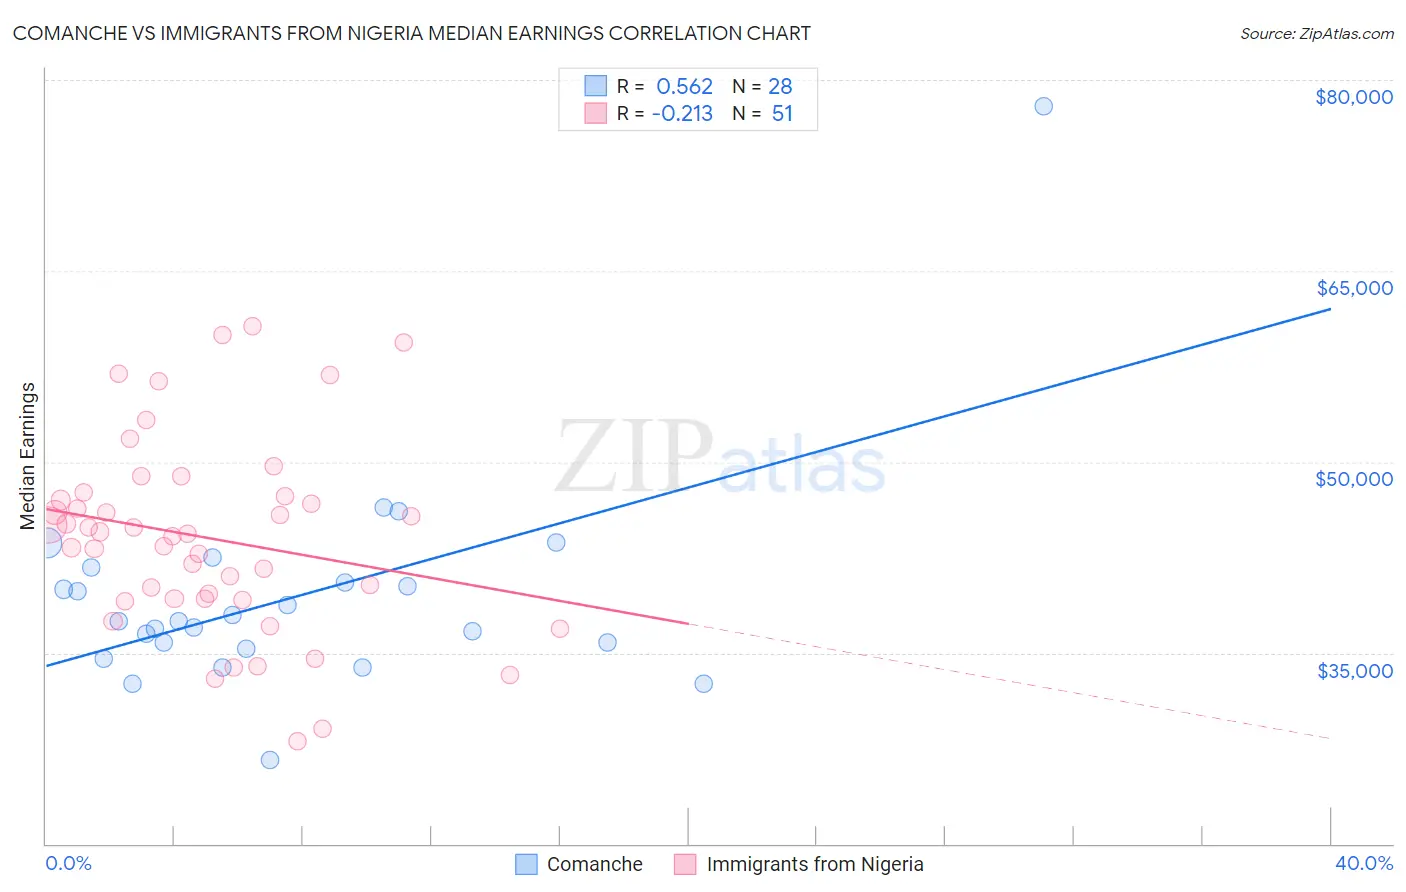
Comanche vs Immigrants from Nigeria Median Earnings Correlation Chart
The statistical analysis conducted on geographies consisting of 109,778,903 people shows a substantial positive correlation between the proportion of Comanche and median earnings in the United States with a correlation coefficient (R) of 0.562 and weighted average of $41,519. Similarly, the statistical analysis conducted on geographies consisting of 283,479,904 people shows a weak negative correlation between the proportion of Immigrants from Nigeria and median earnings in the United States with a correlation coefficient (R) of -0.213 and weighted average of $45,030, a difference of 8.5%.
Median Earnings Correlation Summary
| Measurement | Comanche | Immigrants from Nigeria |
| Minimum | $26,595 | $28,094 |
| Maximum | $77,937 | $60,652 |
| Range | $51,342 | $32,558 |
| Mean | $39,371 | $44,023 |
| Median | $37,513 | $44,326 |
| Interquartile 25% (IQ1) | $35,556 | $39,209 |
| Interquartile 75% (IQ3) | $41,131 | $47,273 |
| Interquartile Range (IQR) | $5,575 | $8,064 |
| Standard Deviation (Sample) | $8,724 | $7,558 |
| Standard Deviation (Population) | $8,566 | $7,484 |
Similar Demographics by Median Earnings
Demographics Similar to Comanche by Median Earnings
In terms of median earnings, the demographic groups most similar to Comanche are Paiute ($41,508, a difference of 0.030%), Immigrants from Dominican Republic ($41,554, a difference of 0.080%), Central American Indian ($41,474, a difference of 0.11%), U.S. Virgin Islander ($41,448, a difference of 0.17%), and Indonesian ($41,701, a difference of 0.44%).
| Demographics | Rating | Rank | Median Earnings |
| Africans | 0.2 /100 | #282 | Tragic $41,955 |
| Dominicans | 0.2 /100 | #283 | Tragic $41,864 |
| Blackfeet | 0.2 /100 | #284 | Tragic $41,822 |
| Immigrants | Nicaragua | 0.1 /100 | #285 | Tragic $41,737 |
| Mexican American Indians | 0.1 /100 | #286 | Tragic $41,719 |
| Indonesians | 0.1 /100 | #287 | Tragic $41,701 |
| Immigrants | Dominican Republic | 0.1 /100 | #288 | Tragic $41,554 |
| Comanche | 0.1 /100 | #289 | Tragic $41,519 |
| Paiute | 0.1 /100 | #290 | Tragic $41,508 |
| Central American Indians | 0.1 /100 | #291 | Tragic $41,474 |
| U.S. Virgin Islanders | 0.1 /100 | #292 | Tragic $41,448 |
| Immigrants | Zaire | 0.1 /100 | #293 | Tragic $41,325 |
| Potawatomi | 0.1 /100 | #294 | Tragic $41,288 |
| Bangladeshis | 0.1 /100 | #295 | Tragic $41,263 |
| Cherokee | 0.1 /100 | #296 | Tragic $41,252 |
Demographics Similar to Immigrants from Nigeria by Median Earnings
In terms of median earnings, the demographic groups most similar to Immigrants from Nigeria are Native Hawaiian ($45,027, a difference of 0.010%), Immigrants from Iraq ($44,988, a difference of 0.090%), Immigrants from Cambodia ($45,090, a difference of 0.13%), West Indian ($45,132, a difference of 0.23%), and Scotch-Irish ($44,924, a difference of 0.24%).
| Demographics | Rating | Rank | Median Earnings |
| Dutch | 18.4 /100 | #219 | Poor $45,370 |
| Ecuadorians | 15.3 /100 | #220 | Poor $45,214 |
| Immigrants | Guyana | 15.1 /100 | #221 | Poor $45,204 |
| Immigrants | Panama | 15.0 /100 | #222 | Poor $45,198 |
| Whites/Caucasians | 15.0 /100 | #223 | Poor $45,197 |
| West Indians | 13.9 /100 | #224 | Poor $45,132 |
| Immigrants | Cambodia | 13.2 /100 | #225 | Poor $45,090 |
| Immigrants | Nigeria | 12.2 /100 | #226 | Poor $45,030 |
| Native Hawaiians | 12.2 /100 | #227 | Poor $45,027 |
| Immigrants | Iraq | 11.6 /100 | #228 | Poor $44,988 |
| Scotch-Irish | 10.7 /100 | #229 | Poor $44,924 |
| Immigrants | Western Africa | 10.3 /100 | #230 | Poor $44,893 |
| Japanese | 9.5 /100 | #231 | Tragic $44,825 |
| Delaware | 9.0 /100 | #232 | Tragic $44,783 |
| Immigrants | Sudan | 8.8 /100 | #233 | Tragic $44,767 |