Turkish vs Immigrants from Zimbabwe Median Earnings
COMPARE
Turkish
Immigrants from Zimbabwe
Median Earnings
Median Earnings Comparison
Turks
Immigrants from Zimbabwe
$53,919
MEDIAN EARNINGS
100.0/ 100
METRIC RATING
25th/ 347
METRIC RANK
$48,913
MEDIAN EARNINGS
97.0/ 100
METRIC RATING
111th/ 347
METRIC RANK
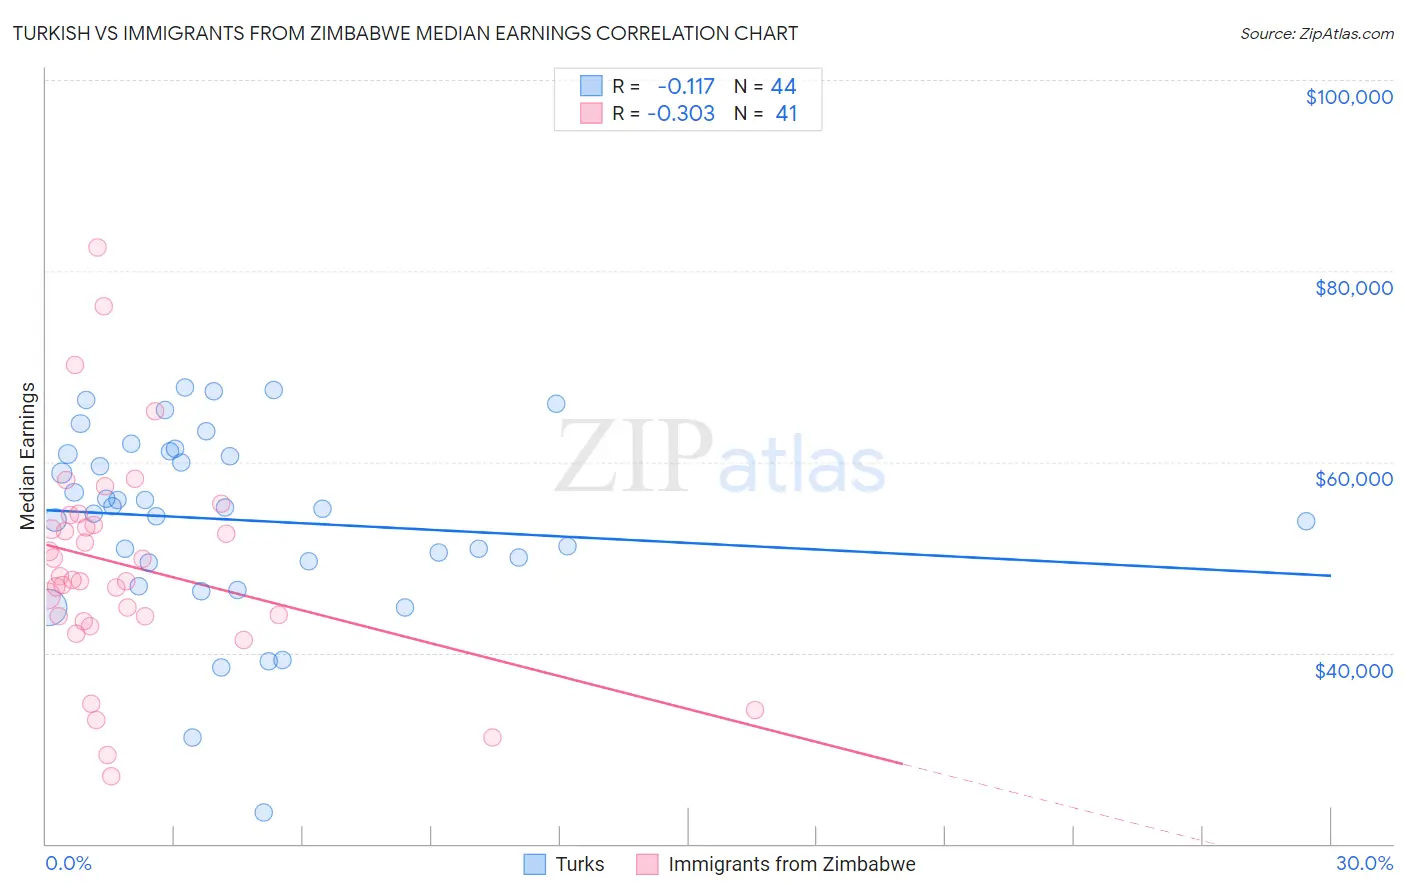
Turkish vs Immigrants from Zimbabwe Median Earnings Correlation Chart
The statistical analysis conducted on geographies consisting of 271,840,547 people shows a poor negative correlation between the proportion of Turks and median earnings in the United States with a correlation coefficient (R) of -0.117 and weighted average of $53,919. Similarly, the statistical analysis conducted on geographies consisting of 117,811,113 people shows a mild negative correlation between the proportion of Immigrants from Zimbabwe and median earnings in the United States with a correlation coefficient (R) of -0.303 and weighted average of $48,913, a difference of 10.2%.
Median Earnings Correlation Summary
| Measurement | Turkish | Immigrants from Zimbabwe |
| Minimum | $23,333 | $27,083 |
| Maximum | $67,805 | $82,500 |
| Range | $44,472 | $55,417 |
| Mean | $53,919 | $49,057 |
| Median | $55,155 | $47,680 |
| Interquartile 25% (IQ1) | $49,523 | $43,542 |
| Interquartile 75% (IQ3) | $60,942 | $53,907 |
| Interquartile Range (IQR) | $11,419 | $10,364 |
| Standard Deviation (Sample) | $9,775 | $11,395 |
| Standard Deviation (Population) | $9,664 | $11,255 |
Similar Demographics by Median Earnings
Demographics Similar to Turks by Median Earnings
In terms of median earnings, the demographic groups most similar to Turks are Immigrants from Northern Europe ($53,872, a difference of 0.090%), Asian ($53,690, a difference of 0.43%), Soviet Union ($54,290, a difference of 0.69%), Immigrants from France ($53,490, a difference of 0.80%), and Immigrants from Russia ($53,457, a difference of 0.86%).
| Demographics | Rating | Rank | Median Earnings |
| Immigrants | Japan | 100.0 /100 | #18 | Exceptional $54,938 |
| Immigrants | Belgium | 100.0 /100 | #19 | Exceptional $54,679 |
| Cypriots | 100.0 /100 | #20 | Exceptional $54,589 |
| Burmese | 100.0 /100 | #21 | Exceptional $54,559 |
| Immigrants | Korea | 100.0 /100 | #22 | Exceptional $54,530 |
| Immigrants | Sweden | 100.0 /100 | #23 | Exceptional $54,478 |
| Soviet Union | 100.0 /100 | #24 | Exceptional $54,290 |
| Turks | 100.0 /100 | #25 | Exceptional $53,919 |
| Immigrants | Northern Europe | 100.0 /100 | #26 | Exceptional $53,872 |
| Asians | 100.0 /100 | #27 | Exceptional $53,690 |
| Immigrants | France | 100.0 /100 | #28 | Exceptional $53,490 |
| Immigrants | Russia | 100.0 /100 | #29 | Exceptional $53,457 |
| Cambodians | 100.0 /100 | #30 | Exceptional $53,386 |
| Russians | 100.0 /100 | #31 | Exceptional $53,334 |
| Immigrants | Asia | 100.0 /100 | #32 | Exceptional $53,310 |
Demographics Similar to Immigrants from Zimbabwe by Median Earnings
In terms of median earnings, the demographic groups most similar to Immigrants from Zimbabwe are Immigrants from Ethiopia ($48,924, a difference of 0.020%), Syrian ($48,934, a difference of 0.040%), Northern European ($48,887, a difference of 0.050%), Immigrants from Kuwait ($48,861, a difference of 0.11%), and Moroccan ($48,838, a difference of 0.15%).
| Demographics | Rating | Rank | Median Earnings |
| Immigrants | Brazil | 98.6 /100 | #104 | Exceptional $49,463 |
| Immigrants | Western Asia | 98.4 /100 | #105 | Exceptional $49,389 |
| Immigrants | Albania | 98.4 /100 | #106 | Exceptional $49,377 |
| Immigrants | Morocco | 98.4 /100 | #107 | Exceptional $49,368 |
| Palestinians | 98.0 /100 | #108 | Exceptional $49,209 |
| Syrians | 97.1 /100 | #109 | Exceptional $48,934 |
| Immigrants | Ethiopia | 97.1 /100 | #110 | Exceptional $48,924 |
| Immigrants | Zimbabwe | 97.0 /100 | #111 | Exceptional $48,913 |
| Northern Europeans | 96.9 /100 | #112 | Exceptional $48,887 |
| Immigrants | Kuwait | 96.8 /100 | #113 | Exceptional $48,861 |
| Moroccans | 96.7 /100 | #114 | Exceptional $48,838 |
| Chinese | 96.7 /100 | #115 | Exceptional $48,836 |
| Koreans | 96.2 /100 | #116 | Exceptional $48,727 |
| Serbians | 95.9 /100 | #117 | Exceptional $48,677 |
| Immigrants | Jordan | 95.9 /100 | #118 | Exceptional $48,673 |