Comanche vs Immigrants from Zimbabwe Associate's Degree
COMPARE
Comanche
Immigrants from Zimbabwe
Associate's Degree
Associate's Degree Comparison
Comanche
Immigrants from Zimbabwe
39.9%
ASSOCIATE'S DEGREE
0.1/ 100
METRIC RATING
284th/ 347
METRIC RANK
50.5%
ASSOCIATE'S DEGREE
99.2/ 100
METRIC RATING
76th/ 347
METRIC RANK
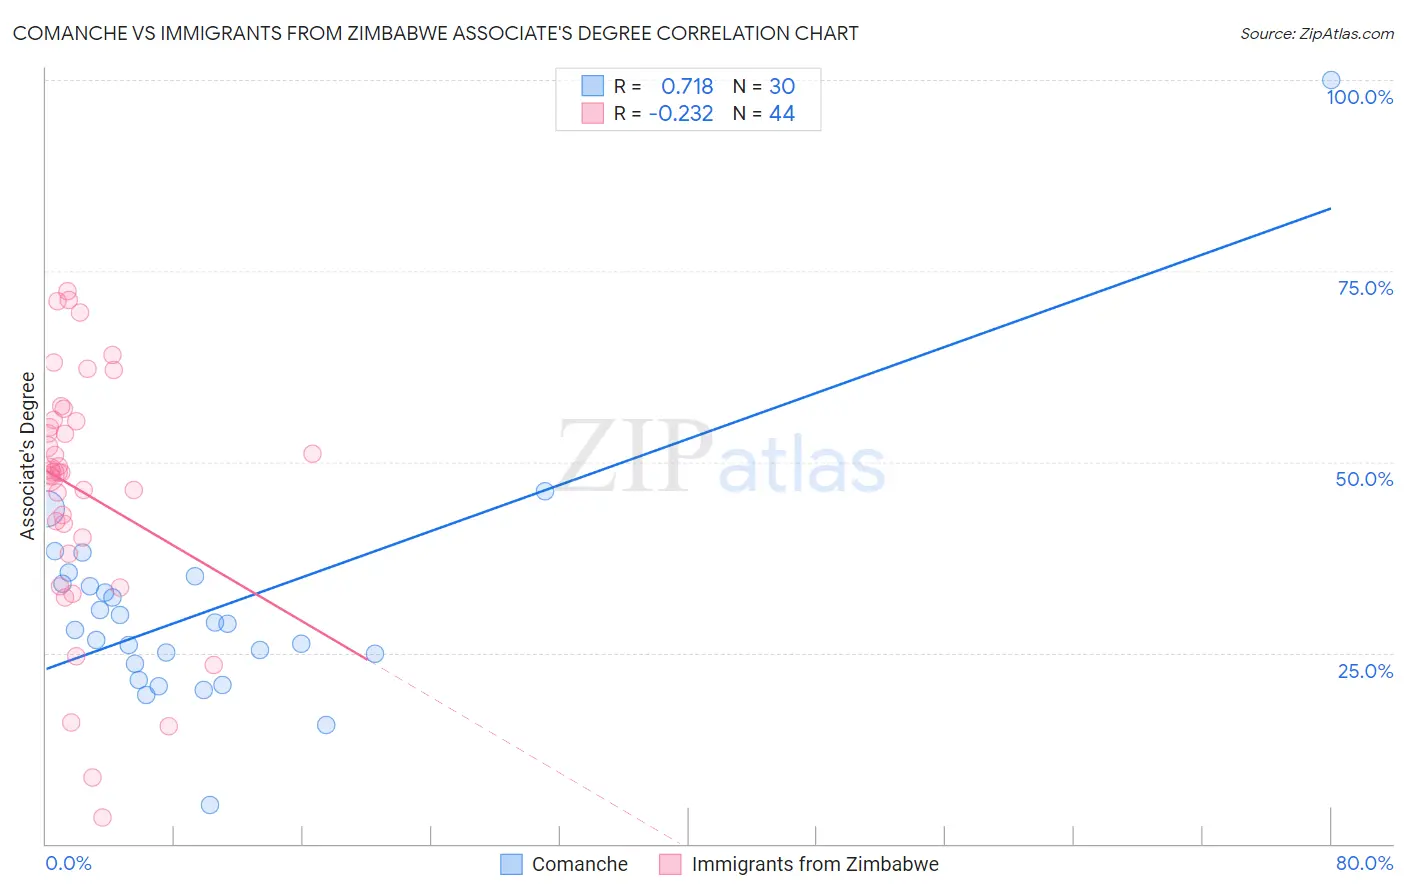
Comanche vs Immigrants from Zimbabwe Associate's Degree Correlation Chart
The statistical analysis conducted on geographies consisting of 109,785,632 people shows a strong positive correlation between the proportion of Comanche and percentage of population with at least associate's degree education in the United States with a correlation coefficient (R) of 0.718 and weighted average of 39.9%. Similarly, the statistical analysis conducted on geographies consisting of 117,809,864 people shows a weak negative correlation between the proportion of Immigrants from Zimbabwe and percentage of population with at least associate's degree education in the United States with a correlation coefficient (R) of -0.232 and weighted average of 50.5%, a difference of 26.5%.
Associate's Degree Correlation Summary
| Measurement | Comanche | Immigrants from Zimbabwe |
| Minimum | 5.1% | 3.5% |
| Maximum | 100.0% | 72.3% |
| Range | 94.9% | 68.9% |
| Mean | 30.6% | 46.2% |
| Median | 28.4% | 48.6% |
| Interquartile 25% (IQ1) | 23.5% | 39.0% |
| Interquartile 75% (IQ3) | 34.0% | 55.5% |
| Interquartile Range (IQR) | 10.5% | 16.4% |
| Standard Deviation (Sample) | 15.6% | 16.2% |
| Standard Deviation (Population) | 15.3% | 16.0% |
Similar Demographics by Associate's Degree
Demographics Similar to Comanche by Associate's Degree
In terms of associate's degree, the demographic groups most similar to Comanche are Immigrants from Belize (39.9%, a difference of 0.10%), Haitian (40.0%, a difference of 0.12%), Bangladeshi (40.0%, a difference of 0.26%), Immigrants from Caribbean (39.7%, a difference of 0.44%), and Immigrants from Portugal (40.1%, a difference of 0.58%).
| Demographics | Rating | Rank | Associate's Degree |
| Blackfeet | 0.1 /100 | #277 | Tragic 40.3% |
| Ottawa | 0.1 /100 | #278 | Tragic 40.3% |
| Immigrants | Nicaragua | 0.1 /100 | #279 | Tragic 40.3% |
| Immigrants | Micronesia | 0.1 /100 | #280 | Tragic 40.2% |
| Immigrants | Portugal | 0.1 /100 | #281 | Tragic 40.1% |
| Bangladeshis | 0.1 /100 | #282 | Tragic 40.0% |
| Haitians | 0.1 /100 | #283 | Tragic 40.0% |
| Comanche | 0.1 /100 | #284 | Tragic 39.9% |
| Immigrants | Belize | 0.1 /100 | #285 | Tragic 39.9% |
| Immigrants | Caribbean | 0.0 /100 | #286 | Tragic 39.7% |
| Aleuts | 0.0 /100 | #287 | Tragic 39.6% |
| Immigrants | Cuba | 0.0 /100 | #288 | Tragic 39.5% |
| Central Americans | 0.0 /100 | #289 | Tragic 39.4% |
| Immigrants | Haiti | 0.0 /100 | #290 | Tragic 39.3% |
| Dominicans | 0.0 /100 | #291 | Tragic 39.3% |
Demographics Similar to Immigrants from Zimbabwe by Associate's Degree
In terms of associate's degree, the demographic groups most similar to Immigrants from Zimbabwe are Immigrants from Lebanon (50.5%, a difference of 0.030%), Immigrants from Eastern Europe (50.5%, a difference of 0.080%), Ethiopian (50.4%, a difference of 0.090%), Armenian (50.4%, a difference of 0.12%), and Maltese (50.4%, a difference of 0.19%).
| Demographics | Rating | Rank | Associate's Degree |
| Egyptians | 99.5 /100 | #69 | Exceptional 50.9% |
| Immigrants | Argentina | 99.5 /100 | #70 | Exceptional 50.9% |
| Immigrants | Romania | 99.5 /100 | #71 | Exceptional 50.9% |
| Immigrants | Pakistan | 99.5 /100 | #72 | Exceptional 50.9% |
| Carpatho Rusyns | 99.3 /100 | #73 | Exceptional 50.6% |
| Lithuanians | 99.3 /100 | #74 | Exceptional 50.6% |
| Immigrants | Scotland | 99.3 /100 | #75 | Exceptional 50.6% |
| Immigrants | Zimbabwe | 99.2 /100 | #76 | Exceptional 50.5% |
| Immigrants | Lebanon | 99.1 /100 | #77 | Exceptional 50.5% |
| Immigrants | Eastern Europe | 99.1 /100 | #78 | Exceptional 50.5% |
| Ethiopians | 99.1 /100 | #79 | Exceptional 50.4% |
| Armenians | 99.1 /100 | #80 | Exceptional 50.4% |
| Maltese | 99.1 /100 | #81 | Exceptional 50.4% |
| Greeks | 98.9 /100 | #82 | Exceptional 50.3% |
| Immigrants | Uzbekistan | 98.9 /100 | #83 | Exceptional 50.3% |