Comanche vs Immigrants from Zimbabwe Male Disability
COMPARE
Comanche
Immigrants from Zimbabwe
Male Disability
Male Disability Comparison
Comanche
Immigrants from Zimbabwe
14.1%
MALE DISABILITY
0.0/ 100
METRIC RATING
324th/ 347
METRIC RANK
10.8%
MALE DISABILITY
93.0/ 100
METRIC RATING
113th/ 347
METRIC RANK
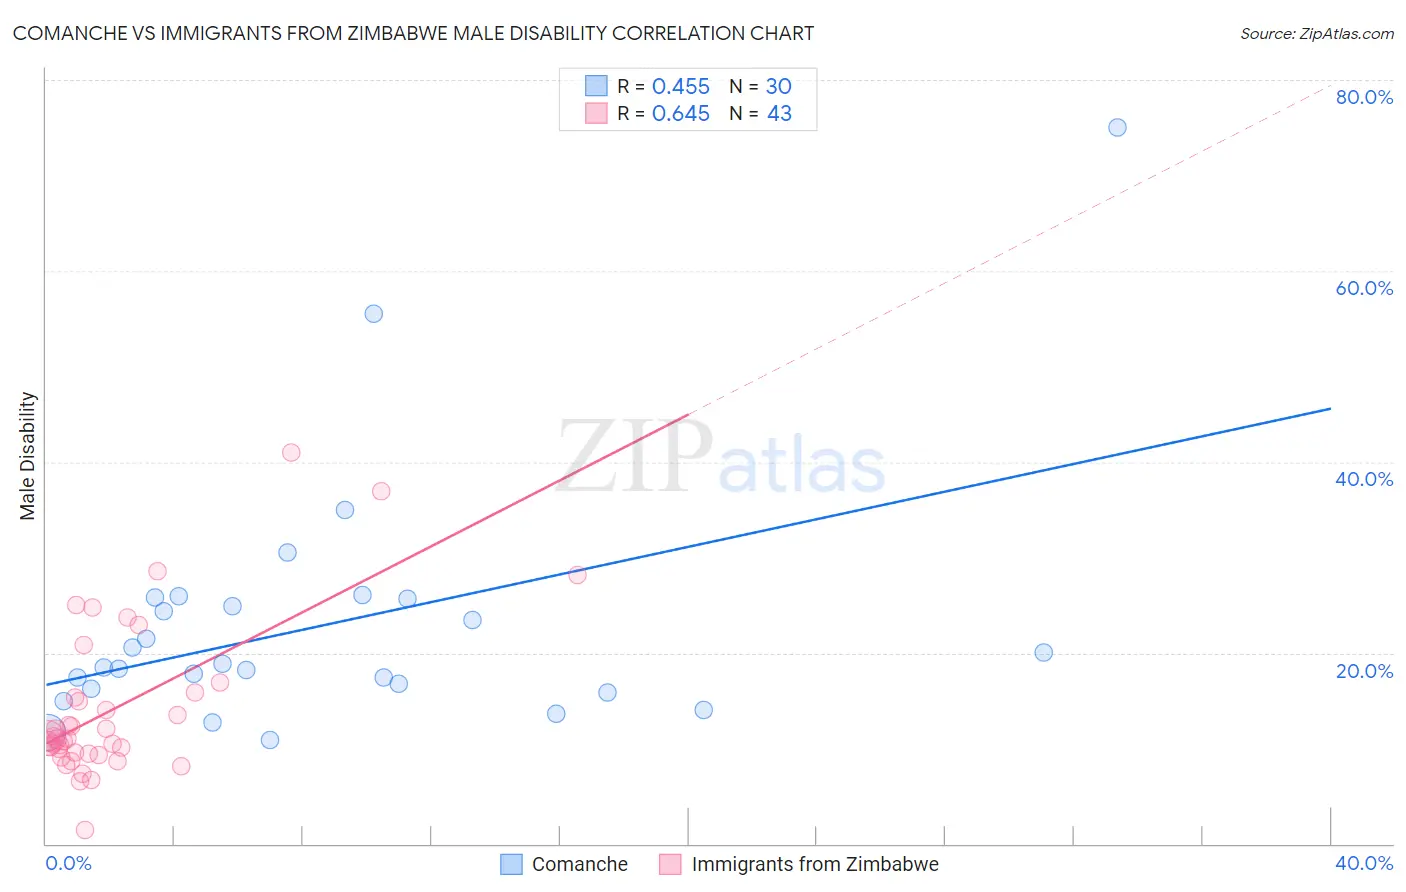
Comanche vs Immigrants from Zimbabwe Male Disability Correlation Chart
The statistical analysis conducted on geographies consisting of 109,776,737 people shows a moderate positive correlation between the proportion of Comanche and percentage of males with a disability in the United States with a correlation coefficient (R) of 0.455 and weighted average of 14.1%. Similarly, the statistical analysis conducted on geographies consisting of 117,811,453 people shows a significant positive correlation between the proportion of Immigrants from Zimbabwe and percentage of males with a disability in the United States with a correlation coefficient (R) of 0.645 and weighted average of 10.8%, a difference of 30.0%.
Male Disability Correlation Summary
| Measurement | Comanche | Immigrants from Zimbabwe |
| Minimum | 10.8% | 1.5% |
| Maximum | 75.0% | 41.0% |
| Range | 64.2% | 39.5% |
| Mean | 22.9% | 14.2% |
| Median | 18.7% | 11.0% |
| Interquartile 25% (IQ1) | 16.2% | 9.4% |
| Interquartile 75% (IQ3) | 25.7% | 15.9% |
| Interquartile Range (IQR) | 9.5% | 6.5% |
| Standard Deviation (Sample) | 13.1% | 8.2% |
| Standard Deviation (Population) | 12.8% | 8.1% |
Similar Demographics by Male Disability
Demographics Similar to Comanche by Male Disability
In terms of male disability, the demographic groups most similar to Comanche are Ottawa (14.1%, a difference of 0.11%), Osage (14.0%, a difference of 0.33%), Apache (14.0%, a difference of 0.40%), Native/Alaskan (14.2%, a difference of 1.1%), and Potawatomi (14.2%, a difference of 1.1%).
| Demographics | Rating | Rank | Male Disability |
| Paiute | 0.0 /100 | #317 | Tragic 13.7% |
| Cree | 0.0 /100 | #318 | Tragic 13.7% |
| Americans | 0.0 /100 | #319 | Tragic 13.8% |
| Tlingit-Haida | 0.0 /100 | #320 | Tragic 13.8% |
| Shoshone | 0.0 /100 | #321 | Tragic 13.8% |
| Apache | 0.0 /100 | #322 | Tragic 14.0% |
| Osage | 0.0 /100 | #323 | Tragic 14.0% |
| Comanche | 0.0 /100 | #324 | Tragic 14.1% |
| Ottawa | 0.0 /100 | #325 | Tragic 14.1% |
| Natives/Alaskans | 0.0 /100 | #326 | Tragic 14.2% |
| Potawatomi | 0.0 /100 | #327 | Tragic 14.2% |
| Chippewa | 0.0 /100 | #328 | Tragic 14.3% |
| Cajuns | 0.0 /100 | #329 | Tragic 14.4% |
| Navajo | 0.0 /100 | #330 | Tragic 14.4% |
| Tohono O'odham | 0.0 /100 | #331 | Tragic 14.6% |
Demographics Similar to Immigrants from Zimbabwe by Male Disability
In terms of male disability, the demographic groups most similar to Immigrants from Zimbabwe are Central American (10.8%, a difference of 0.070%), Ghanaian (10.8%, a difference of 0.090%), Immigrants from Barbados (10.8%, a difference of 0.16%), Immigrants from Uruguay (10.8%, a difference of 0.18%), and Immigrants (10.8%, a difference of 0.22%).
| Demographics | Rating | Rank | Male Disability |
| Immigrants | Syria | 94.9 /100 | #106 | Exceptional 10.8% |
| Immigrants | Eastern Africa | 94.3 /100 | #107 | Exceptional 10.8% |
| Immigrants | Belgium | 94.2 /100 | #108 | Exceptional 10.8% |
| Immigrants | Uganda | 94.0 /100 | #109 | Exceptional 10.8% |
| Immigrants | Immigrants | 93.9 /100 | #110 | Exceptional 10.8% |
| Immigrants | Uruguay | 93.8 /100 | #111 | Exceptional 10.8% |
| Ghanaians | 93.4 /100 | #112 | Exceptional 10.8% |
| Immigrants | Zimbabwe | 93.0 /100 | #113 | Exceptional 10.8% |
| Central Americans | 92.7 /100 | #114 | Exceptional 10.8% |
| Immigrants | Barbados | 92.2 /100 | #115 | Exceptional 10.8% |
| Immigrants | South Africa | 91.8 /100 | #116 | Exceptional 10.8% |
| Eastern Europeans | 90.6 /100 | #117 | Exceptional 10.9% |
| Immigrants | Cuba | 90.2 /100 | #118 | Exceptional 10.9% |
| Armenians | 90.1 /100 | #119 | Exceptional 10.9% |
| Immigrants | Africa | 89.4 /100 | #120 | Excellent 10.9% |