Okinawan vs Immigrants from Zimbabwe Median Earnings
COMPARE
Okinawan
Immigrants from Zimbabwe
Median Earnings
Median Earnings Comparison
Okinawans
Immigrants from Zimbabwe
$57,550
MEDIAN EARNINGS
100.0/ 100
METRIC RATING
9th/ 347
METRIC RANK
$48,913
MEDIAN EARNINGS
97.0/ 100
METRIC RATING
111th/ 347
METRIC RANK
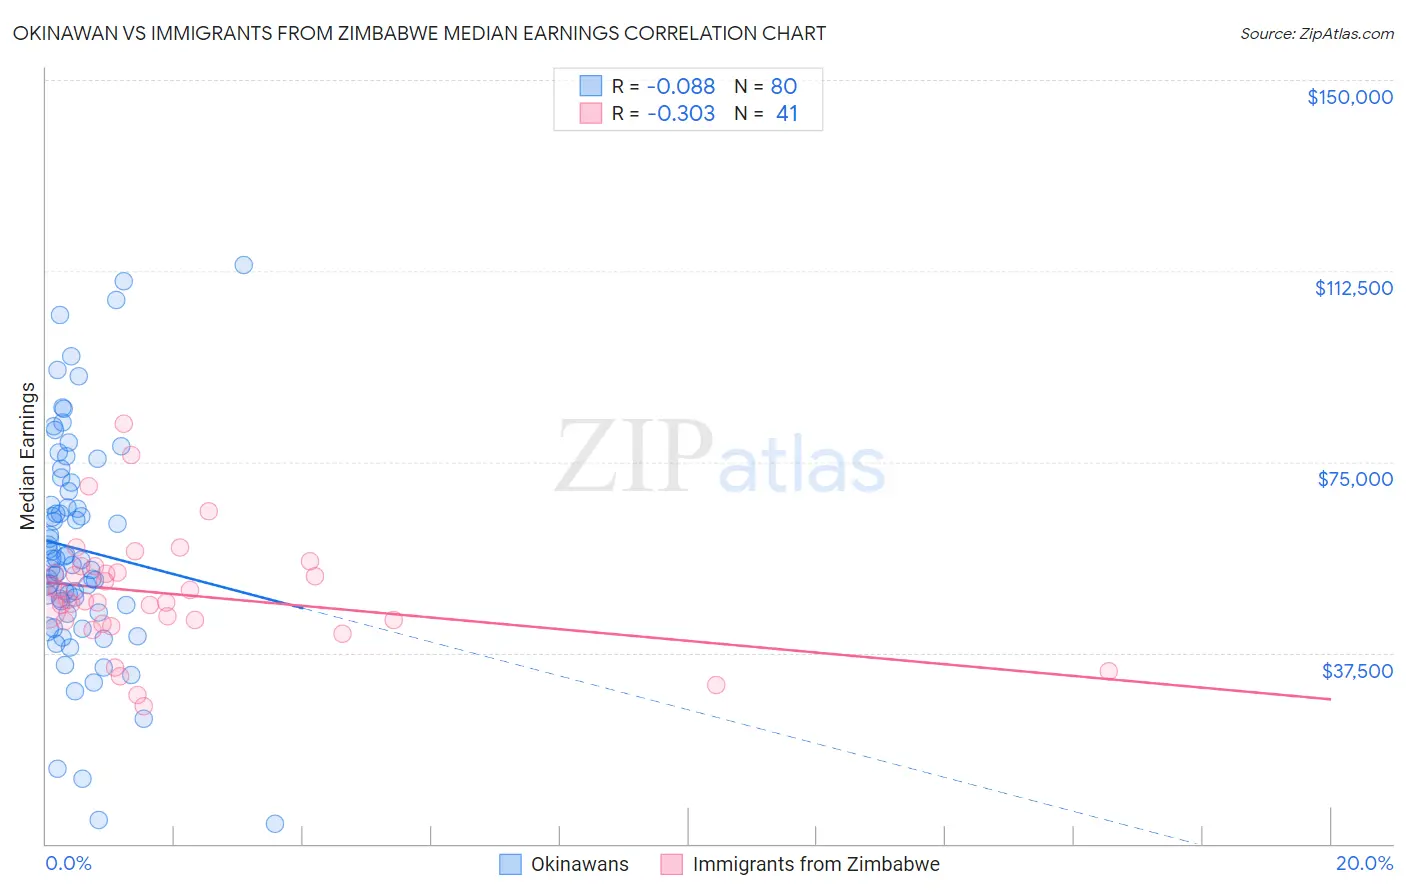
Okinawan vs Immigrants from Zimbabwe Median Earnings Correlation Chart
The statistical analysis conducted on geographies consisting of 73,779,677 people shows a slight negative correlation between the proportion of Okinawans and median earnings in the United States with a correlation coefficient (R) of -0.088 and weighted average of $57,550. Similarly, the statistical analysis conducted on geographies consisting of 117,811,113 people shows a mild negative correlation between the proportion of Immigrants from Zimbabwe and median earnings in the United States with a correlation coefficient (R) of -0.303 and weighted average of $48,913, a difference of 17.7%.
Median Earnings Correlation Summary
| Measurement | Okinawan | Immigrants from Zimbabwe |
| Minimum | $4,007 | $27,083 |
| Maximum | $113,728 | $82,500 |
| Range | $109,721 | $55,417 |
| Mean | $57,919 | $49,057 |
| Median | $55,875 | $47,680 |
| Interquartile 25% (IQ1) | $46,156 | $43,542 |
| Interquartile 75% (IQ3) | $70,001 | $53,907 |
| Interquartile Range (IQR) | $23,845 | $10,364 |
| Standard Deviation (Sample) | $21,992 | $11,395 |
| Standard Deviation (Population) | $21,854 | $11,255 |
Similar Demographics by Median Earnings
Demographics Similar to Okinawans by Median Earnings
In terms of median earnings, the demographic groups most similar to Okinawans are Immigrants from Iran ($57,612, a difference of 0.11%), Immigrants from South Central Asia ($57,114, a difference of 0.76%), Immigrants from Israel ($57,034, a difference of 0.90%), Immigrants from Ireland ($56,854, a difference of 1.2%), and Iranian ($58,474, a difference of 1.6%).
| Demographics | Rating | Rank | Median Earnings |
| Immigrants | Taiwan | 100.0 /100 | #2 | Exceptional $61,151 |
| Immigrants | India | 100.0 /100 | #3 | Exceptional $60,648 |
| Immigrants | Hong Kong | 100.0 /100 | #4 | Exceptional $59,433 |
| Thais | 100.0 /100 | #5 | Exceptional $59,237 |
| Immigrants | Singapore | 100.0 /100 | #6 | Exceptional $59,038 |
| Iranians | 100.0 /100 | #7 | Exceptional $58,474 |
| Immigrants | Iran | 100.0 /100 | #8 | Exceptional $57,612 |
| Okinawans | 100.0 /100 | #9 | Exceptional $57,550 |
| Immigrants | South Central Asia | 100.0 /100 | #10 | Exceptional $57,114 |
| Immigrants | Israel | 100.0 /100 | #11 | Exceptional $57,034 |
| Immigrants | Ireland | 100.0 /100 | #12 | Exceptional $56,854 |
| Immigrants | China | 100.0 /100 | #13 | Exceptional $56,638 |
| Immigrants | Australia | 100.0 /100 | #14 | Exceptional $56,305 |
| Indians (Asian) | 100.0 /100 | #15 | Exceptional $56,253 |
| Immigrants | Eastern Asia | 100.0 /100 | #16 | Exceptional $56,183 |
Demographics Similar to Immigrants from Zimbabwe by Median Earnings
In terms of median earnings, the demographic groups most similar to Immigrants from Zimbabwe are Immigrants from Ethiopia ($48,924, a difference of 0.020%), Syrian ($48,934, a difference of 0.040%), Northern European ($48,887, a difference of 0.050%), Immigrants from Kuwait ($48,861, a difference of 0.11%), and Moroccan ($48,838, a difference of 0.15%).
| Demographics | Rating | Rank | Median Earnings |
| Immigrants | Brazil | 98.6 /100 | #104 | Exceptional $49,463 |
| Immigrants | Western Asia | 98.4 /100 | #105 | Exceptional $49,389 |
| Immigrants | Albania | 98.4 /100 | #106 | Exceptional $49,377 |
| Immigrants | Morocco | 98.4 /100 | #107 | Exceptional $49,368 |
| Palestinians | 98.0 /100 | #108 | Exceptional $49,209 |
| Syrians | 97.1 /100 | #109 | Exceptional $48,934 |
| Immigrants | Ethiopia | 97.1 /100 | #110 | Exceptional $48,924 |
| Immigrants | Zimbabwe | 97.0 /100 | #111 | Exceptional $48,913 |
| Northern Europeans | 96.9 /100 | #112 | Exceptional $48,887 |
| Immigrants | Kuwait | 96.8 /100 | #113 | Exceptional $48,861 |
| Moroccans | 96.7 /100 | #114 | Exceptional $48,838 |
| Chinese | 96.7 /100 | #115 | Exceptional $48,836 |
| Koreans | 96.2 /100 | #116 | Exceptional $48,727 |
| Serbians | 95.9 /100 | #117 | Exceptional $48,677 |
| Immigrants | Jordan | 95.9 /100 | #118 | Exceptional $48,673 |