Comanche vs Czech Median Earnings
COMPARE
Comanche
Czech
Median Earnings
Median Earnings Comparison
Comanche
Czechs
$41,519
MEDIAN EARNINGS
0.1/ 100
METRIC RATING
289th/ 347
METRIC RANK
$47,221
MEDIAN EARNINGS
75.1/ 100
METRIC RATING
157th/ 347
METRIC RANK
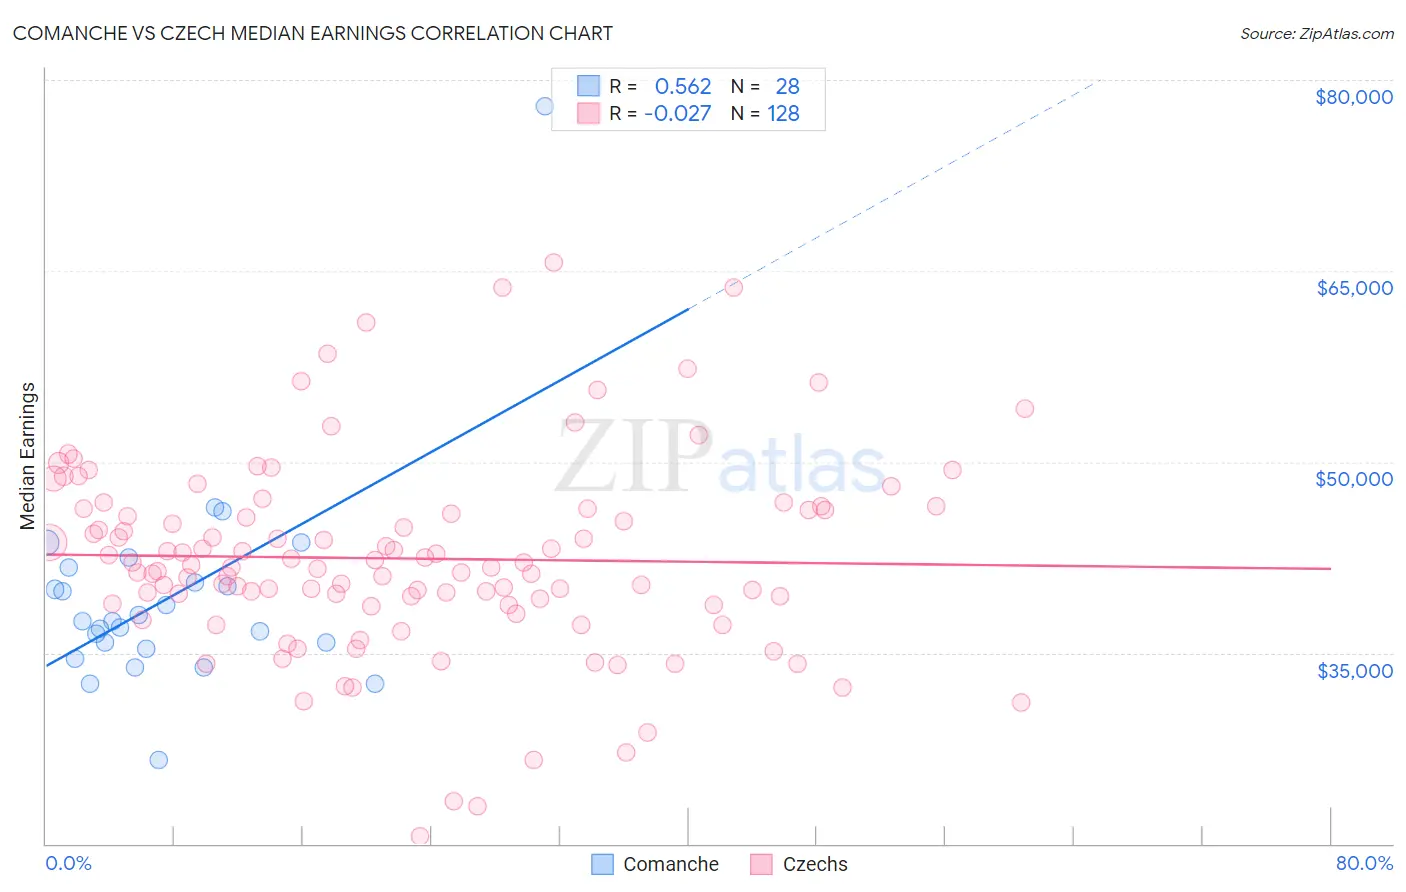
Comanche vs Czech Median Earnings Correlation Chart
The statistical analysis conducted on geographies consisting of 109,778,903 people shows a substantial positive correlation between the proportion of Comanche and median earnings in the United States with a correlation coefficient (R) of 0.562 and weighted average of $41,519. Similarly, the statistical analysis conducted on geographies consisting of 484,720,536 people shows no correlation between the proportion of Czechs and median earnings in the United States with a correlation coefficient (R) of -0.027 and weighted average of $47,221, a difference of 13.7%.
Median Earnings Correlation Summary
| Measurement | Comanche | Czech |
| Minimum | $26,595 | $20,625 |
| Maximum | $77,937 | $65,656 |
| Range | $51,342 | $45,031 |
| Mean | $39,371 | $42,405 |
| Median | $37,513 | $41,812 |
| Interquartile 25% (IQ1) | $35,556 | $38,782 |
| Interquartile 75% (IQ3) | $41,131 | $46,266 |
| Interquartile Range (IQR) | $5,575 | $7,485 |
| Standard Deviation (Sample) | $8,724 | $7,742 |
| Standard Deviation (Population) | $8,566 | $7,712 |
Similar Demographics by Median Earnings
Demographics Similar to Comanche by Median Earnings
In terms of median earnings, the demographic groups most similar to Comanche are Paiute ($41,508, a difference of 0.030%), Immigrants from Dominican Republic ($41,554, a difference of 0.080%), Central American Indian ($41,474, a difference of 0.11%), U.S. Virgin Islander ($41,448, a difference of 0.17%), and Indonesian ($41,701, a difference of 0.44%).
| Demographics | Rating | Rank | Median Earnings |
| Africans | 0.2 /100 | #282 | Tragic $41,955 |
| Dominicans | 0.2 /100 | #283 | Tragic $41,864 |
| Blackfeet | 0.2 /100 | #284 | Tragic $41,822 |
| Immigrants | Nicaragua | 0.1 /100 | #285 | Tragic $41,737 |
| Mexican American Indians | 0.1 /100 | #286 | Tragic $41,719 |
| Indonesians | 0.1 /100 | #287 | Tragic $41,701 |
| Immigrants | Dominican Republic | 0.1 /100 | #288 | Tragic $41,554 |
| Comanche | 0.1 /100 | #289 | Tragic $41,519 |
| Paiute | 0.1 /100 | #290 | Tragic $41,508 |
| Central American Indians | 0.1 /100 | #291 | Tragic $41,474 |
| U.S. Virgin Islanders | 0.1 /100 | #292 | Tragic $41,448 |
| Immigrants | Zaire | 0.1 /100 | #293 | Tragic $41,325 |
| Potawatomi | 0.1 /100 | #294 | Tragic $41,288 |
| Bangladeshis | 0.1 /100 | #295 | Tragic $41,263 |
| Cherokee | 0.1 /100 | #296 | Tragic $41,252 |
Demographics Similar to Czechs by Median Earnings
In terms of median earnings, the demographic groups most similar to Czechs are Irish ($47,276, a difference of 0.12%), Immigrants from Vietnam ($47,282, a difference of 0.13%), Immigrants from Portugal ($47,304, a difference of 0.18%), Slovak ($47,095, a difference of 0.27%), and Immigrants from Peru ($47,025, a difference of 0.42%).
| Demographics | Rating | Rank | Median Earnings |
| Peruvians | 84.2 /100 | #150 | Excellent $47,628 |
| Immigrants | Oceania | 84.1 /100 | #151 | Excellent $47,617 |
| Immigrants | Germany | 83.1 /100 | #152 | Excellent $47,566 |
| Slavs | 81.1 /100 | #153 | Excellent $47,470 |
| Immigrants | Portugal | 77.3 /100 | #154 | Good $47,304 |
| Immigrants | Vietnam | 76.7 /100 | #155 | Good $47,282 |
| Irish | 76.6 /100 | #156 | Good $47,276 |
| Czechs | 75.1 /100 | #157 | Good $47,221 |
| Slovaks | 71.7 /100 | #158 | Good $47,095 |
| Immigrants | Peru | 69.6 /100 | #159 | Good $47,025 |
| Alsatians | 69.6 /100 | #160 | Good $47,023 |
| Immigrants | Eastern Africa | 68.0 /100 | #161 | Good $46,969 |
| South American Indians | 67.4 /100 | #162 | Good $46,952 |
| Icelanders | 66.3 /100 | #163 | Good $46,916 |
| Norwegians | 64.7 /100 | #164 | Good $46,865 |