Comanche vs Immigrants from Israel Median Earnings
COMPARE
Comanche
Immigrants from Israel
Median Earnings
Median Earnings Comparison
Comanche
Immigrants from Israel
$41,519
MEDIAN EARNINGS
0.1/ 100
METRIC RATING
289th/ 347
METRIC RANK
$57,034
MEDIAN EARNINGS
100.0/ 100
METRIC RATING
11th/ 347
METRIC RANK
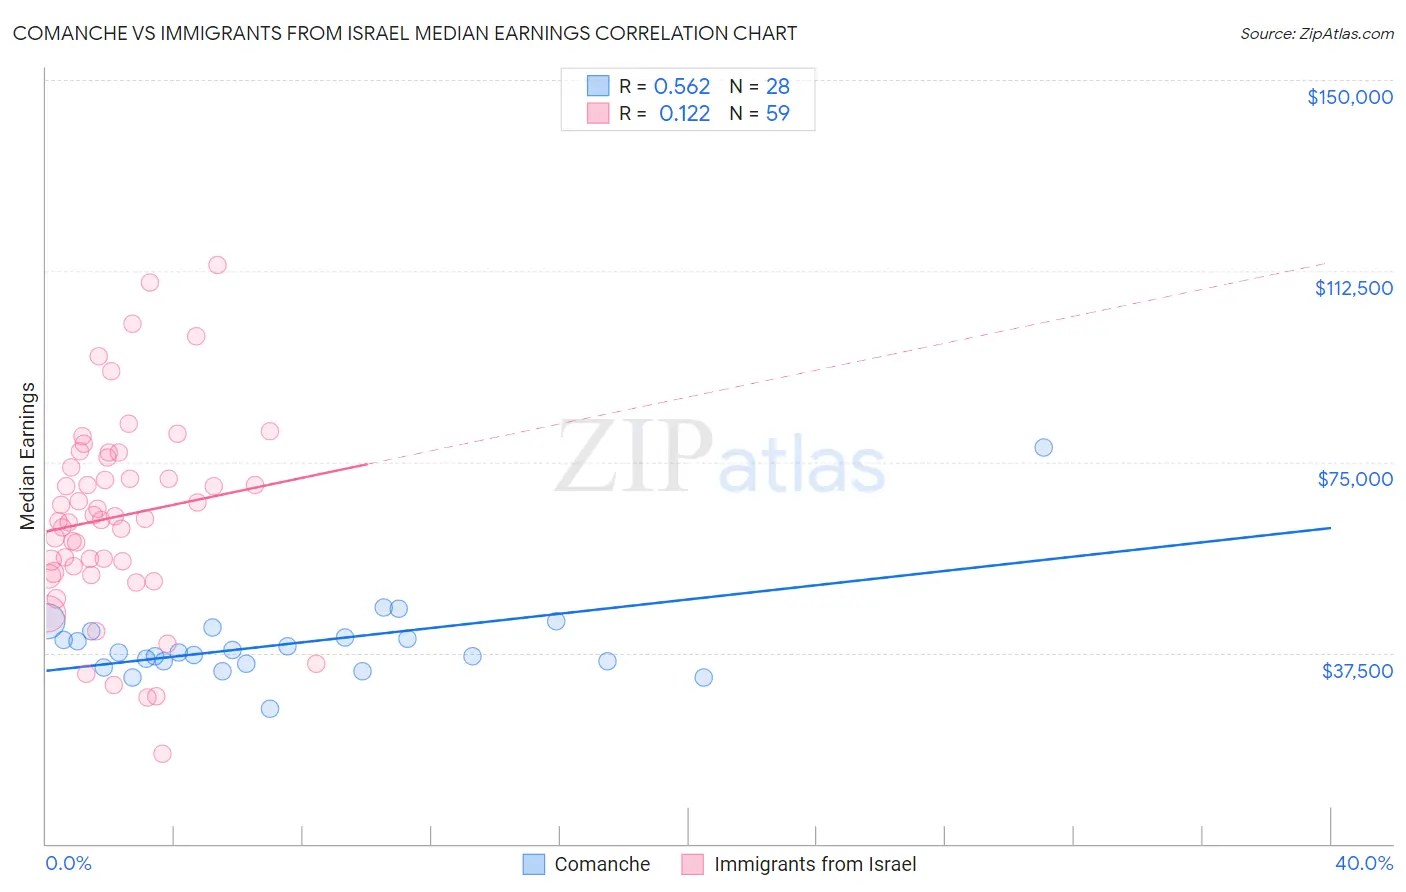
Comanche vs Immigrants from Israel Median Earnings Correlation Chart
The statistical analysis conducted on geographies consisting of 109,778,903 people shows a substantial positive correlation between the proportion of Comanche and median earnings in the United States with a correlation coefficient (R) of 0.562 and weighted average of $41,519. Similarly, the statistical analysis conducted on geographies consisting of 210,025,881 people shows a poor positive correlation between the proportion of Immigrants from Israel and median earnings in the United States with a correlation coefficient (R) of 0.122 and weighted average of $57,034, a difference of 37.4%.
Median Earnings Correlation Summary
| Measurement | Comanche | Immigrants from Israel |
| Minimum | $26,595 | $17,782 |
| Maximum | $77,937 | $113,636 |
| Range | $51,342 | $95,854 |
| Mean | $39,371 | $64,255 |
| Median | $37,513 | $63,844 |
| Interquartile 25% (IQ1) | $35,556 | $53,296 |
| Interquartile 75% (IQ3) | $41,131 | $75,870 |
| Interquartile Range (IQR) | $5,575 | $22,574 |
| Standard Deviation (Sample) | $8,724 | $19,481 |
| Standard Deviation (Population) | $8,566 | $19,315 |
Similar Demographics by Median Earnings
Demographics Similar to Comanche by Median Earnings
In terms of median earnings, the demographic groups most similar to Comanche are Paiute ($41,508, a difference of 0.030%), Immigrants from Dominican Republic ($41,554, a difference of 0.080%), Central American Indian ($41,474, a difference of 0.11%), U.S. Virgin Islander ($41,448, a difference of 0.17%), and Indonesian ($41,701, a difference of 0.44%).
| Demographics | Rating | Rank | Median Earnings |
| Africans | 0.2 /100 | #282 | Tragic $41,955 |
| Dominicans | 0.2 /100 | #283 | Tragic $41,864 |
| Blackfeet | 0.2 /100 | #284 | Tragic $41,822 |
| Immigrants | Nicaragua | 0.1 /100 | #285 | Tragic $41,737 |
| Mexican American Indians | 0.1 /100 | #286 | Tragic $41,719 |
| Indonesians | 0.1 /100 | #287 | Tragic $41,701 |
| Immigrants | Dominican Republic | 0.1 /100 | #288 | Tragic $41,554 |
| Comanche | 0.1 /100 | #289 | Tragic $41,519 |
| Paiute | 0.1 /100 | #290 | Tragic $41,508 |
| Central American Indians | 0.1 /100 | #291 | Tragic $41,474 |
| U.S. Virgin Islanders | 0.1 /100 | #292 | Tragic $41,448 |
| Immigrants | Zaire | 0.1 /100 | #293 | Tragic $41,325 |
| Potawatomi | 0.1 /100 | #294 | Tragic $41,288 |
| Bangladeshis | 0.1 /100 | #295 | Tragic $41,263 |
| Cherokee | 0.1 /100 | #296 | Tragic $41,252 |
Demographics Similar to Immigrants from Israel by Median Earnings
In terms of median earnings, the demographic groups most similar to Immigrants from Israel are Immigrants from South Central Asia ($57,114, a difference of 0.14%), Immigrants from Ireland ($56,854, a difference of 0.32%), Immigrants from China ($56,638, a difference of 0.70%), Okinawan ($57,550, a difference of 0.90%), and Immigrants from Iran ($57,612, a difference of 1.0%).
| Demographics | Rating | Rank | Median Earnings |
| Immigrants | Hong Kong | 100.0 /100 | #4 | Exceptional $59,433 |
| Thais | 100.0 /100 | #5 | Exceptional $59,237 |
| Immigrants | Singapore | 100.0 /100 | #6 | Exceptional $59,038 |
| Iranians | 100.0 /100 | #7 | Exceptional $58,474 |
| Immigrants | Iran | 100.0 /100 | #8 | Exceptional $57,612 |
| Okinawans | 100.0 /100 | #9 | Exceptional $57,550 |
| Immigrants | South Central Asia | 100.0 /100 | #10 | Exceptional $57,114 |
| Immigrants | Israel | 100.0 /100 | #11 | Exceptional $57,034 |
| Immigrants | Ireland | 100.0 /100 | #12 | Exceptional $56,854 |
| Immigrants | China | 100.0 /100 | #13 | Exceptional $56,638 |
| Immigrants | Australia | 100.0 /100 | #14 | Exceptional $56,305 |
| Indians (Asian) | 100.0 /100 | #15 | Exceptional $56,253 |
| Immigrants | Eastern Asia | 100.0 /100 | #16 | Exceptional $56,183 |
| Eastern Europeans | 100.0 /100 | #17 | Exceptional $55,084 |
| Immigrants | Japan | 100.0 /100 | #18 | Exceptional $54,938 |