Comanche vs Chickasaw Median Earnings
COMPARE
Comanche
Chickasaw
Median Earnings
Median Earnings Comparison
Comanche
Chickasaw
$41,519
MEDIAN EARNINGS
0.1/ 100
METRIC RATING
289th/ 347
METRIC RANK
$40,672
MEDIAN EARNINGS
0.0/ 100
METRIC RATING
305th/ 347
METRIC RANK
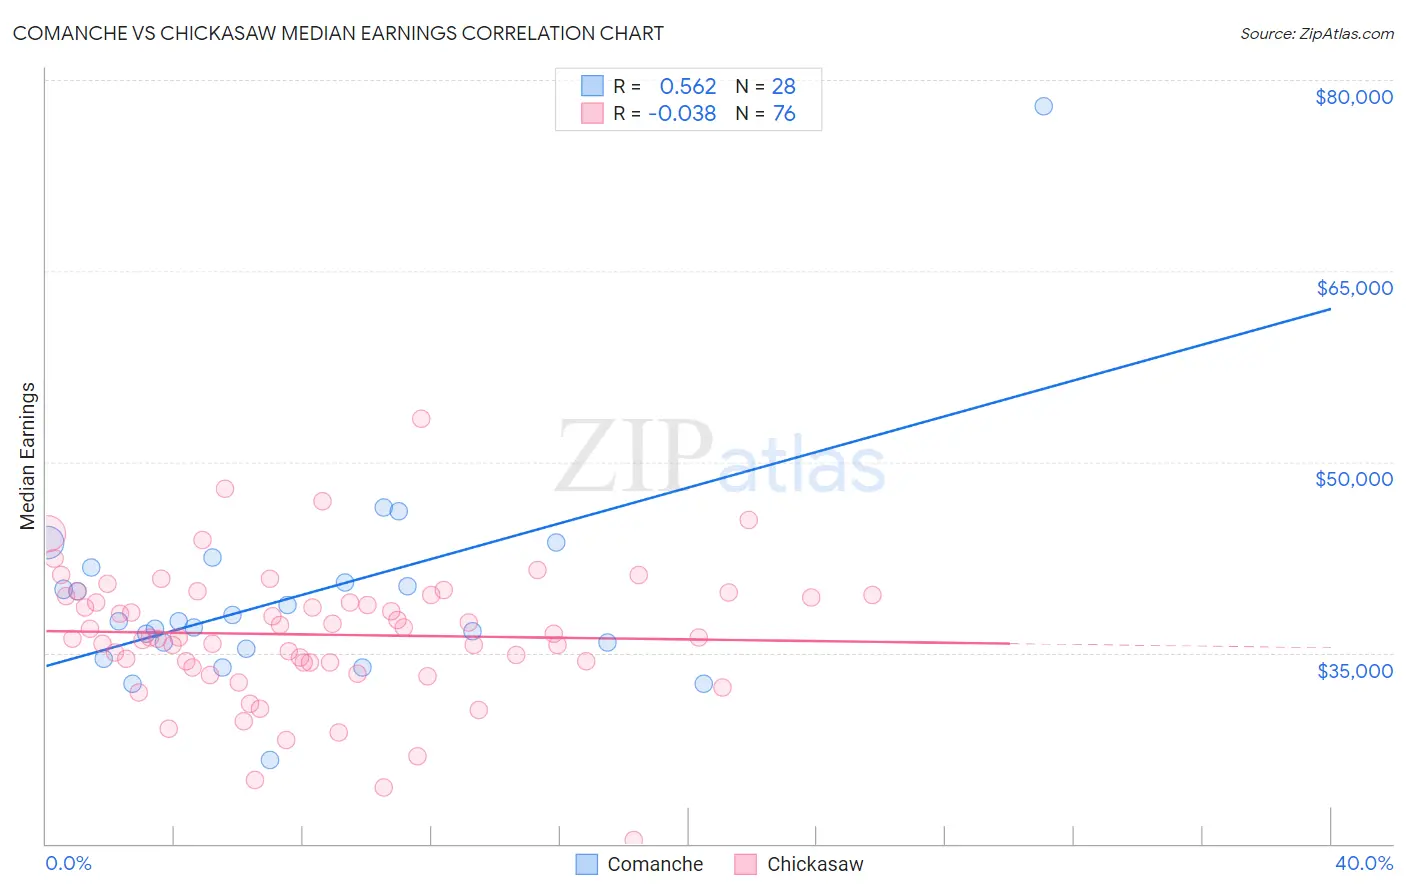
Comanche vs Chickasaw Median Earnings Correlation Chart
The statistical analysis conducted on geographies consisting of 109,778,903 people shows a substantial positive correlation between the proportion of Comanche and median earnings in the United States with a correlation coefficient (R) of 0.562 and weighted average of $41,519. Similarly, the statistical analysis conducted on geographies consisting of 147,718,191 people shows no correlation between the proportion of Chickasaw and median earnings in the United States with a correlation coefficient (R) of -0.038 and weighted average of $40,672, a difference of 2.1%.
Median Earnings Correlation Summary
| Measurement | Comanche | Chickasaw |
| Minimum | $26,595 | $20,250 |
| Maximum | $77,937 | $53,432 |
| Range | $51,342 | $33,182 |
| Mean | $39,371 | $36,428 |
| Median | $37,513 | $36,238 |
| Interquartile 25% (IQ1) | $35,556 | $34,220 |
| Interquartile 75% (IQ3) | $41,131 | $39,491 |
| Interquartile Range (IQR) | $5,575 | $5,270 |
| Standard Deviation (Sample) | $8,724 | $5,289 |
| Standard Deviation (Population) | $8,566 | $5,254 |
Demographics Similar to Comanche and Chickasaw by Median Earnings
In terms of median earnings, the demographic groups most similar to Comanche are Paiute ($41,508, a difference of 0.030%), Immigrants from Dominican Republic ($41,554, a difference of 0.080%), Central American Indian ($41,474, a difference of 0.11%), U.S. Virgin Islander ($41,448, a difference of 0.17%), and Indonesian ($41,701, a difference of 0.44%). Similarly, the demographic groups most similar to Chickasaw are Yaqui ($40,647, a difference of 0.060%), Honduran ($40,638, a difference of 0.080%), Immigrants from Guatemala ($40,851, a difference of 0.44%), Haitian ($40,918, a difference of 0.60%), and Shoshone ($40,932, a difference of 0.64%).
| Demographics | Rating | Rank | Median Earnings |
| Indonesians | 0.1 /100 | #287 | Tragic $41,701 |
| Immigrants | Dominican Republic | 0.1 /100 | #288 | Tragic $41,554 |
| Comanche | 0.1 /100 | #289 | Tragic $41,519 |
| Paiute | 0.1 /100 | #290 | Tragic $41,508 |
| Central American Indians | 0.1 /100 | #291 | Tragic $41,474 |
| U.S. Virgin Islanders | 0.1 /100 | #292 | Tragic $41,448 |
| Immigrants | Zaire | 0.1 /100 | #293 | Tragic $41,325 |
| Potawatomi | 0.1 /100 | #294 | Tragic $41,288 |
| Bangladeshis | 0.1 /100 | #295 | Tragic $41,263 |
| Cherokee | 0.1 /100 | #296 | Tragic $41,252 |
| Guatemalans | 0.1 /100 | #297 | Tragic $41,205 |
| Immigrants | Micronesia | 0.1 /100 | #298 | Tragic $41,133 |
| Immigrants | Caribbean | 0.1 /100 | #299 | Tragic $41,119 |
| Ute | 0.1 /100 | #300 | Tragic $41,051 |
| Immigrants | Latin America | 0.1 /100 | #301 | Tragic $41,049 |
| Shoshone | 0.0 /100 | #302 | Tragic $40,932 |
| Haitians | 0.0 /100 | #303 | Tragic $40,918 |
| Immigrants | Guatemala | 0.0 /100 | #304 | Tragic $40,851 |
| Chickasaw | 0.0 /100 | #305 | Tragic $40,672 |
| Yaqui | 0.0 /100 | #306 | Tragic $40,647 |
| Hondurans | 0.0 /100 | #307 | Tragic $40,638 |