Immigrants from Vietnam vs Immigrants from Zimbabwe Median Earnings
COMPARE
Immigrants from Vietnam
Immigrants from Zimbabwe
Median Earnings
Median Earnings Comparison
Immigrants from Vietnam
Immigrants from Zimbabwe
$47,282
MEDIAN EARNINGS
76.7/ 100
METRIC RATING
155th/ 347
METRIC RANK
$48,913
MEDIAN EARNINGS
97.0/ 100
METRIC RATING
111th/ 347
METRIC RANK
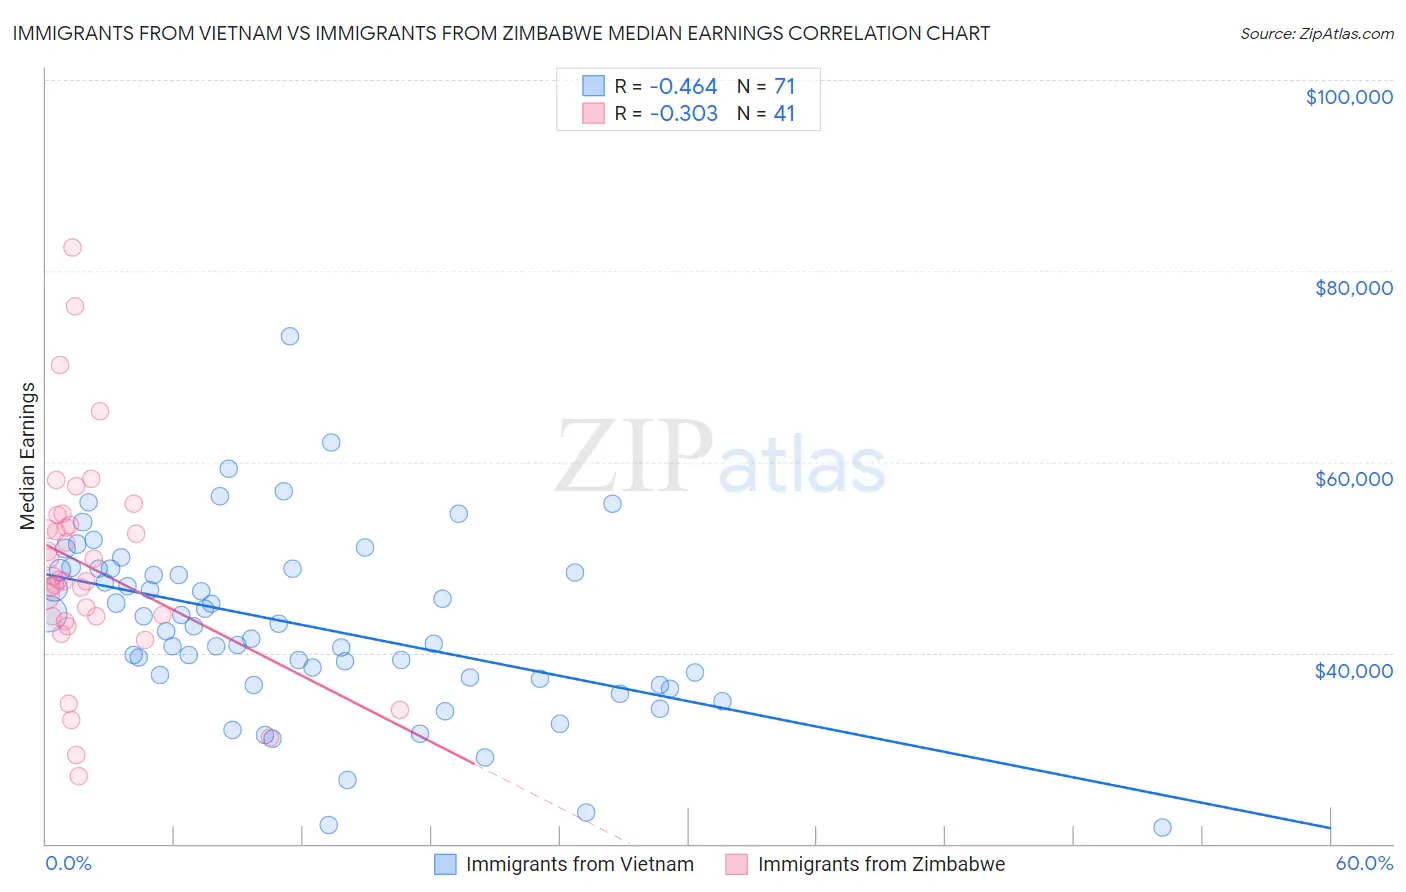
Immigrants from Vietnam vs Immigrants from Zimbabwe Median Earnings Correlation Chart
The statistical analysis conducted on geographies consisting of 404,676,863 people shows a moderate negative correlation between the proportion of Immigrants from Vietnam and median earnings in the United States with a correlation coefficient (R) of -0.464 and weighted average of $47,282. Similarly, the statistical analysis conducted on geographies consisting of 117,811,113 people shows a mild negative correlation between the proportion of Immigrants from Zimbabwe and median earnings in the United States with a correlation coefficient (R) of -0.303 and weighted average of $48,913, a difference of 3.5%.
Median Earnings Correlation Summary
| Measurement | Immigrants from Vietnam | Immigrants from Zimbabwe |
| Minimum | $21,667 | $27,083 |
| Maximum | $73,212 | $82,500 |
| Range | $51,545 | $55,417 |
| Mean | $42,907 | $49,057 |
| Median | $42,737 | $47,680 |
| Interquartile 25% (IQ1) | $37,299 | $43,542 |
| Interquartile 75% (IQ3) | $48,750 | $53,907 |
| Interquartile Range (IQR) | $11,451 | $10,364 |
| Standard Deviation (Sample) | $9,399 | $11,395 |
| Standard Deviation (Population) | $9,333 | $11,255 |
Similar Demographics by Median Earnings
Demographics Similar to Immigrants from Vietnam by Median Earnings
In terms of median earnings, the demographic groups most similar to Immigrants from Vietnam are Irish ($47,276, a difference of 0.010%), Immigrants from Portugal ($47,304, a difference of 0.050%), Czech ($47,221, a difference of 0.13%), Slavic ($47,470, a difference of 0.40%), and Slovak ($47,095, a difference of 0.40%).
| Demographics | Rating | Rank | Median Earnings |
| Immigrants | Eritrea | 84.8 /100 | #148 | Excellent $47,657 |
| Luxembourgers | 84.5 /100 | #149 | Excellent $47,640 |
| Peruvians | 84.2 /100 | #150 | Excellent $47,628 |
| Immigrants | Oceania | 84.1 /100 | #151 | Excellent $47,617 |
| Immigrants | Germany | 83.1 /100 | #152 | Excellent $47,566 |
| Slavs | 81.1 /100 | #153 | Excellent $47,470 |
| Immigrants | Portugal | 77.3 /100 | #154 | Good $47,304 |
| Immigrants | Vietnam | 76.7 /100 | #155 | Good $47,282 |
| Irish | 76.6 /100 | #156 | Good $47,276 |
| Czechs | 75.1 /100 | #157 | Good $47,221 |
| Slovaks | 71.7 /100 | #158 | Good $47,095 |
| Immigrants | Peru | 69.6 /100 | #159 | Good $47,025 |
| Alsatians | 69.6 /100 | #160 | Good $47,023 |
| Immigrants | Eastern Africa | 68.0 /100 | #161 | Good $46,969 |
| South American Indians | 67.4 /100 | #162 | Good $46,952 |
Demographics Similar to Immigrants from Zimbabwe by Median Earnings
In terms of median earnings, the demographic groups most similar to Immigrants from Zimbabwe are Immigrants from Ethiopia ($48,924, a difference of 0.020%), Syrian ($48,934, a difference of 0.040%), Northern European ($48,887, a difference of 0.050%), Immigrants from Kuwait ($48,861, a difference of 0.11%), and Moroccan ($48,838, a difference of 0.15%).
| Demographics | Rating | Rank | Median Earnings |
| Immigrants | Brazil | 98.6 /100 | #104 | Exceptional $49,463 |
| Immigrants | Western Asia | 98.4 /100 | #105 | Exceptional $49,389 |
| Immigrants | Albania | 98.4 /100 | #106 | Exceptional $49,377 |
| Immigrants | Morocco | 98.4 /100 | #107 | Exceptional $49,368 |
| Palestinians | 98.0 /100 | #108 | Exceptional $49,209 |
| Syrians | 97.1 /100 | #109 | Exceptional $48,934 |
| Immigrants | Ethiopia | 97.1 /100 | #110 | Exceptional $48,924 |
| Immigrants | Zimbabwe | 97.0 /100 | #111 | Exceptional $48,913 |
| Northern Europeans | 96.9 /100 | #112 | Exceptional $48,887 |
| Immigrants | Kuwait | 96.8 /100 | #113 | Exceptional $48,861 |
| Moroccans | 96.7 /100 | #114 | Exceptional $48,838 |
| Chinese | 96.7 /100 | #115 | Exceptional $48,836 |
| Koreans | 96.2 /100 | #116 | Exceptional $48,727 |
| Serbians | 95.9 /100 | #117 | Exceptional $48,677 |
| Immigrants | Jordan | 95.9 /100 | #118 | Exceptional $48,673 |