Comanche vs Czech Child Poverty Among Girls Under 16

COMPARE

Comanche
Race
Ancestry
AfghanAfricanAlaska NativeAlaskan AthabascanAlbanianAleutAlsatianAmericanApacheArabArapahoArgentineanArmenianAssyrian/Chaldean/SyriacAustralianAustrianBahamianBangladeshiBarbadianBasqueBelgianBelizeanBermudanBhutaneseBlackfeetBolivianBrazilianBritishBritish West IndianBulgarianBurmeseCajunCambodianCanadianCape VerdeanCarpatho RusynCelticCentral AmericanCentral American IndianCherokeeCheyenneChickasawChileanChineseChippewaChoctawColombianColvilleComancheCosta RicanCreeCreekCroatianCrowCubanCypriotCzechoslovakianDanishDelawareDominicanDutchDutch West IndianEastern EuropeanEcuadorianEgyptianEnglishEstonianEthiopianEuropeanFijianFilipinoFinnishFrenchFrench American IndianFrench CanadianGermanGerman RussianGhanaianGreekGuamanian/ChamorroGuatemalanGuyaneseHaitianHmongHonduranHopiHoumaHungarianIcelanderIndian (Asian)IndonesianInupiatIranianIraqiIrishIroquoisIsraeliItalianJamaicanJapaneseJordanianKenyanKiowaKoreanLaotianLatvianLebaneseLiberianLithuanianLumbeeLuxembourgerMacedonianMalaysianMalteseMarshalleseMenomineeMexicanMexican American IndianMongolianMoroccanNative HawaiianNavajoNepaleseNew ZealanderNicaraguanNigerianNorthern EuropeanNorwegianOkinawanOsageOttawaPaiutePakistaniPalestinianPanamanianParaguayanPennsylvania GermanPeruvianPimaPolishPortuguesePotawatomiPuebloPuerto RicanPuget Sound SalishRomanianRussianSalvadoranSamoanScandinavianScotch-IrishScottishSeminoleSenegaleseSerbianShoshoneSierra LeoneanSiouxSlavicSlovakSloveneSomaliSouth AfricanSouth AmericanSouth American IndianSoviet UnionSpaniardSpanishSpanish AmericanSpanish American IndianSri LankanSubsaharan AfricanSudaneseSwedishSwissSyrianTaiwaneseThaiTlingit-HaidaTohono O'OdhamTonganTrinidadian and TobagonianTsimshianTurkishU.S. Virgin IslanderUgandanUkrainianUruguayanUteVenezuelanVietnameseWelshWest IndianYakamaYaquiYugoslavianYumanYup'ikZimbabwean
Immigration
NonimmigrantsImmigrantsAfghanistanAfricaAlbaniaArgentinaArmeniaAsiaAustraliaAustriaBahamasBangladeshBarbadosBelarusBelgiumBelizeBoliviaBosnia and HerzegovinaBrazilBulgariaBurma/MyanmarCabo VerdeCambodiaCameroonCanadaCaribbeanCentral AmericaChileChinaColombiaCongoCosta RicaCroatiaCubaCzechoslovakiaDenmarkDominicaDominican RepublicEastern AfricaEastern AsiaEastern EuropeEcuadorEgyptEl SalvadorEnglandEritreaEthiopiaEuropeFijiFranceGermanyGhanaGreeceGrenadaGuatemalaGuyanaHaitiHondurasHong KongHungaryIndiaIndonesiaIranIraqIrelandIsraelItalyJamaicaJapanJordanKazakhstanKenyaKoreaKuwaitLaosLatin AmericaLatviaLebanonLiberiaLithuaniaMalaysiaMexicoMicronesiaMiddle AfricaMoldovaMoroccoNepalNetherlandsNicaraguaNigeriaNorth AmericaNorth MacedoniaNorthern AfricaNorthern EuropeNorwayOceaniaPakistanPanamaPeruPhilippinesPolandPortugalRomaniaRussiaSaudi ArabiaScotlandSenegalSerbiaSierra LeoneSingaporeSomaliaSouth AfricaSouth AmericaSouth Central AsiaSouth Eastern AsiaSouthern EuropeSpainSri LankaSt. Vincent and the GrenadinesSudanSwedenSwitzerlandSyriaTaiwanThailandTrinidad and TobagoTurkeyUgandaUkraineUruguayUzbekistanVenezuelaVietnamWest IndiesWestern AfricaWestern AsiaWestern EuropeYemenZaireZimbabweAzores
Czech
Race
Ancestry
AfghanAfricanAlaska NativeAlaskan AthabascanAlbanianAleutAlsatianAmericanApacheArabArapahoArgentineanArmenianAssyrian/Chaldean/SyriacAustralianAustrianBahamianBangladeshiBarbadianBasqueBelgianBelizeanBermudanBhutaneseBlackfeetBolivianBrazilianBritishBritish West IndianBulgarianBurmeseCajunCambodianCanadianCape VerdeanCarpatho RusynCelticCentral AmericanCentral American IndianCherokeeCheyenneChickasawChileanChineseChippewaChoctawColombianColvilleCosta RicanCreeCreekCroatianCrowCubanCypriotCzechCzechoslovakianDanishDelawareDominicanDutchDutch West IndianEastern EuropeanEcuadorianEgyptianEnglishEstonianEthiopianEuropeanFijianFilipinoFinnishFrenchFrench American IndianFrench CanadianGermanGerman RussianGhanaianGreekGuamanian/ChamorroGuatemalanGuyaneseHaitianHmongHonduranHopiHoumaHungarianIcelanderIndian (Asian)IndonesianInupiatIranianIraqiIrishIroquoisIsraeliItalianJamaicanJapaneseJordanianKenyanKiowaKoreanLaotianLatvianLebaneseLiberianLithuanianLumbeeLuxembourgerMacedonianMalaysianMalteseMarshalleseMenomineeMexicanMexican American IndianMongolianMoroccanNative HawaiianNavajoNepaleseNew ZealanderNicaraguanNigerianNorthern EuropeanNorwegianOkinawanOsageOttawaPaiutePakistaniPalestinianPanamanianParaguayanPennsylvania GermanPeruvianPimaPolishPortuguesePotawatomiPuebloPuerto RicanPuget Sound SalishRomanianRussianSalvadoranSamoanScandinavianScotch-IrishScottishSeminoleSenegaleseSerbianShoshoneSierra LeoneanSiouxSlavicSlovakSloveneSomaliSouth AfricanSouth AmericanSouth American IndianSoviet UnionSpaniardSpanishSpanish AmericanSpanish American IndianSri LankanSubsaharan AfricanSudaneseSwedishSwissSyrianTaiwaneseThaiTlingit-HaidaTohono O'OdhamTonganTrinidadian and TobagonianTsimshianTurkishU.S. Virgin IslanderUgandanUkrainianUruguayanUteVenezuelanVietnameseWelshWest IndianYakamaYaquiYugoslavianYumanYup'ikZimbabwean
Immigration
NonimmigrantsImmigrantsAfghanistanAfricaAlbaniaArgentinaArmeniaAsiaAustraliaAustriaBahamasBangladeshBarbadosBelarusBelgiumBelizeBoliviaBosnia and HerzegovinaBrazilBulgariaBurma/MyanmarCabo VerdeCambodiaCameroonCanadaCaribbeanCentral AmericaChileChinaColombiaCongoCosta RicaCroatiaCubaCzechoslovakiaDenmarkDominicaDominican RepublicEastern AfricaEastern AsiaEastern EuropeEcuadorEgyptEl SalvadorEnglandEritreaEthiopiaEuropeFijiFranceGermanyGhanaGreeceGrenadaGuatemalaGuyanaHaitiHondurasHong KongHungaryIndiaIndonesiaIranIraqIrelandIsraelItalyJamaicaJapanJordanKazakhstanKenyaKoreaKuwaitLaosLatin AmericaLatviaLebanonLiberiaLithuaniaMalaysiaMexicoMicronesiaMiddle AfricaMoldovaMoroccoNepalNetherlandsNicaraguaNigeriaNorth AmericaNorth MacedoniaNorthern AfricaNorthern EuropeNorwayOceaniaPakistanPanamaPeruPhilippinesPolandPortugalRomaniaRussiaSaudi ArabiaScotlandSenegalSerbiaSierra LeoneSingaporeSomaliaSouth AfricaSouth AmericaSouth Central AsiaSouth Eastern AsiaSouthern EuropeSpainSri LankaSt. Vincent and the GrenadinesSudanSwedenSwitzerlandSyriaTaiwanThailandTrinidad and TobagoTurkeyUgandaUkraineUruguayUzbekistanVenezuelaVietnamWest IndiesWestern AfricaWestern AsiaWestern EuropeYemenZaireZimbabweAzores
Child Poverty Among Girls Under 16
Income
Poverty
Unemployment
Labor Participation
Family Structure
Vehicle Availability
Education Level
Disability

Child Poverty Among Girls Under 16 Comparison

Comanche

Czechs

Tragic
Exceptional
20.2%
CHILD POVERTY AMONG GIRLS UNDER 16
0.0/ 100
METRIC RATING
276th/ 347
METRIC RANK
14.2%
CHILD POVERTY AMONG GIRLS UNDER 16
99.3/ 100
METRIC RATING
48th/ 347
METRIC RANK

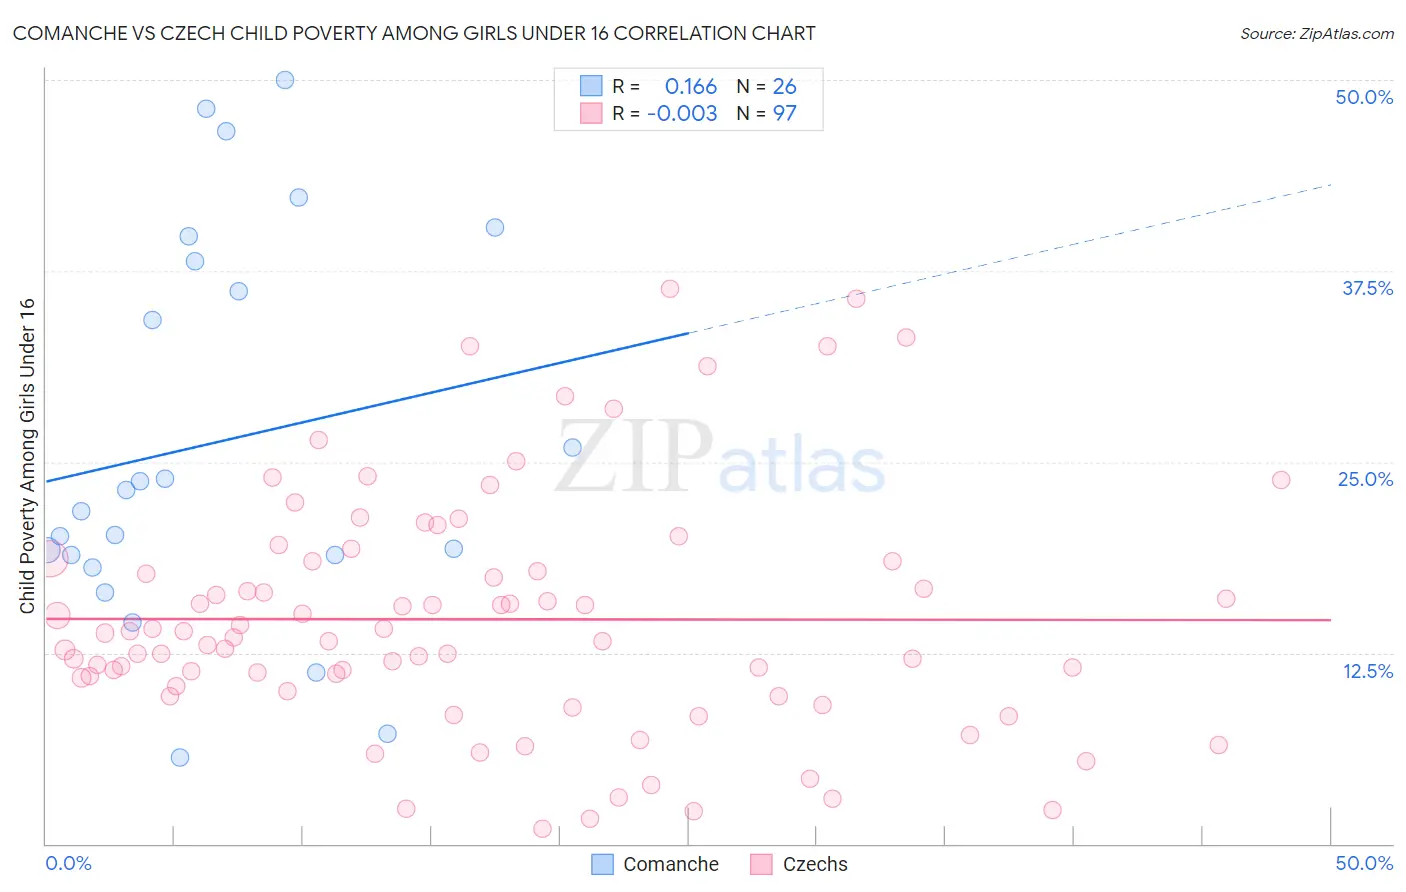
Comanche vs Czech Child Poverty Among Girls Under 16 Correlation Chart

The statistical analysis conducted on geographies consisting of 109,392,517 people shows a poor positive correlation between the proportion of Comanche and poverty level among girls under the age of 16 in the United States with a correlation coefficient (R) of 0.166 and weighted average of 20.2%. Similarly, the statistical analysis conducted on geographies consisting of 470,185,036 people shows no correlation between the proportion of Czechs and poverty level among girls under the age of 16 in the United States with a correlation coefficient (R) of -0.003 and weighted average of 14.2%, a difference of 42.6%.
Comanche vs Czech Child Poverty Among Girls Under 16

Child Poverty Among Girls Under 16 Correlation Summary

MeasurementComancheCzech
Minimum5.6%0.95%
Maximum50.0%36.4%
Range44.4%35.4%
Mean26.3%14.7%
Median22.5%13.5%
Interquartile 25% (IQ1)18.9%10.1%
Interquartile 75% (IQ3)38.2%18.5%
Interquartile Range (IQR)19.3%8.4%
Standard Deviation (Sample)12.7%7.8%
Standard Deviation (Population)12.5%7.8%

Similar Demographics by Child Poverty Among Girls Under 16

Demographics Similar to Comanche by Child Poverty Among Girls Under 16

In terms of child poverty among girls under 16, the demographic groups most similar to Comanche are Belizean (20.2%, a difference of 0.11%), Barbadian (20.2%, a difference of 0.14%), Immigrants from Zaire (20.2%, a difference of 0.27%), Immigrants from Liberia (20.2%, a difference of 0.28%), and Subsaharan African (20.1%, a difference of 0.32%).
DemographicsRating | RankChild Poverty Among Girls Under 16
Liberians
0.1
/100
|
#269
Tragic
19.9%
Cherokee
0.1
/100
|
#270
Tragic
19.9%
Immigrants | Barbados
0.1
/100
|
#271
Tragic
19.9%
Immigrants | El Salvador
0.1
/100
|
#272
Tragic
20.0%
Bangladeshis
0.1
/100
|
#273
Tragic
20.0%
Immigrants | St. Vincent and the Grenadines
0.0
/100
|
#274
Tragic
20.1%
Sub-Saharan Africans
0.0
/100
|
#275
Tragic
20.1%
Comanche
0.0
/100
|
#276
Tragic
20.2%
Belizeans
0.0
/100
|
#277
Tragic
20.2%
Barbadians
0.0
/100
|
#278
Tragic
20.2%
Immigrants | Zaire
0.0
/100
|
#279
Tragic
20.2%
Immigrants | Liberia
0.0
/100
|
#280
Tragic
20.2%
Central Americans
0.0
/100
|
#281
Tragic
20.2%
West Indians
0.0
/100
|
#282
Tragic
20.3%
Senegalese
0.0
/100
|
#283
Tragic
20.3%

Demographics Similar to Czechs by Child Poverty Among Girls Under 16

In terms of child poverty among girls under 16, the demographic groups most similar to Czechs are Immigrants from Czechoslovakia (14.2%, a difference of 0.020%), Croatian (14.1%, a difference of 0.040%), Greek (14.2%, a difference of 0.040%), Immigrants from Greece (14.1%, a difference of 0.070%), and Immigrants from Israel (14.2%, a difference of 0.11%).
DemographicsRating | RankChild Poverty Among Girls Under 16
Immigrants | Bolivia
99.5
/100
|
#41
Exceptional
14.0%
Immigrants | Scotland
99.4
/100
|
#42
Exceptional
14.0%
Koreans
99.4
/100
|
#43
Exceptional
14.1%
Immigrants | Asia
99.4
/100
|
#44
Exceptional
14.1%
Immigrants | Greece
99.3
/100
|
#45
Exceptional
14.1%
Croatians
99.3
/100
|
#46
Exceptional
14.1%
Immigrants | Czechoslovakia
99.3
/100
|
#47
Exceptional
14.2%
Czechs
99.3
/100
|
#48
Exceptional
14.2%
Greeks
99.2
/100
|
#49
Exceptional
14.2%
Immigrants | Israel
99.2
/100
|
#50
Exceptional
14.2%
Immigrants | Pakistan
99.1
/100
|
#51
Exceptional
14.2%
Italians
99.1
/100
|
#52
Exceptional
14.3%
Luxembourgers
99.0
/100
|
#53
Exceptional
14.3%
Estonians
98.9
/100
|
#54
Exceptional
14.3%
Immigrants | Romania
98.9
/100
|
#55
Exceptional
14.3%