Immigrants from Liberia vs Czech Median Earnings
COMPARE
Immigrants from Liberia
Czech
Median Earnings
Median Earnings Comparison
Immigrants from Liberia
Czechs
$42,923
MEDIAN EARNINGS
0.7/ 100
METRIC RATING
264th/ 347
METRIC RANK
$47,221
MEDIAN EARNINGS
75.1/ 100
METRIC RATING
157th/ 347
METRIC RANK
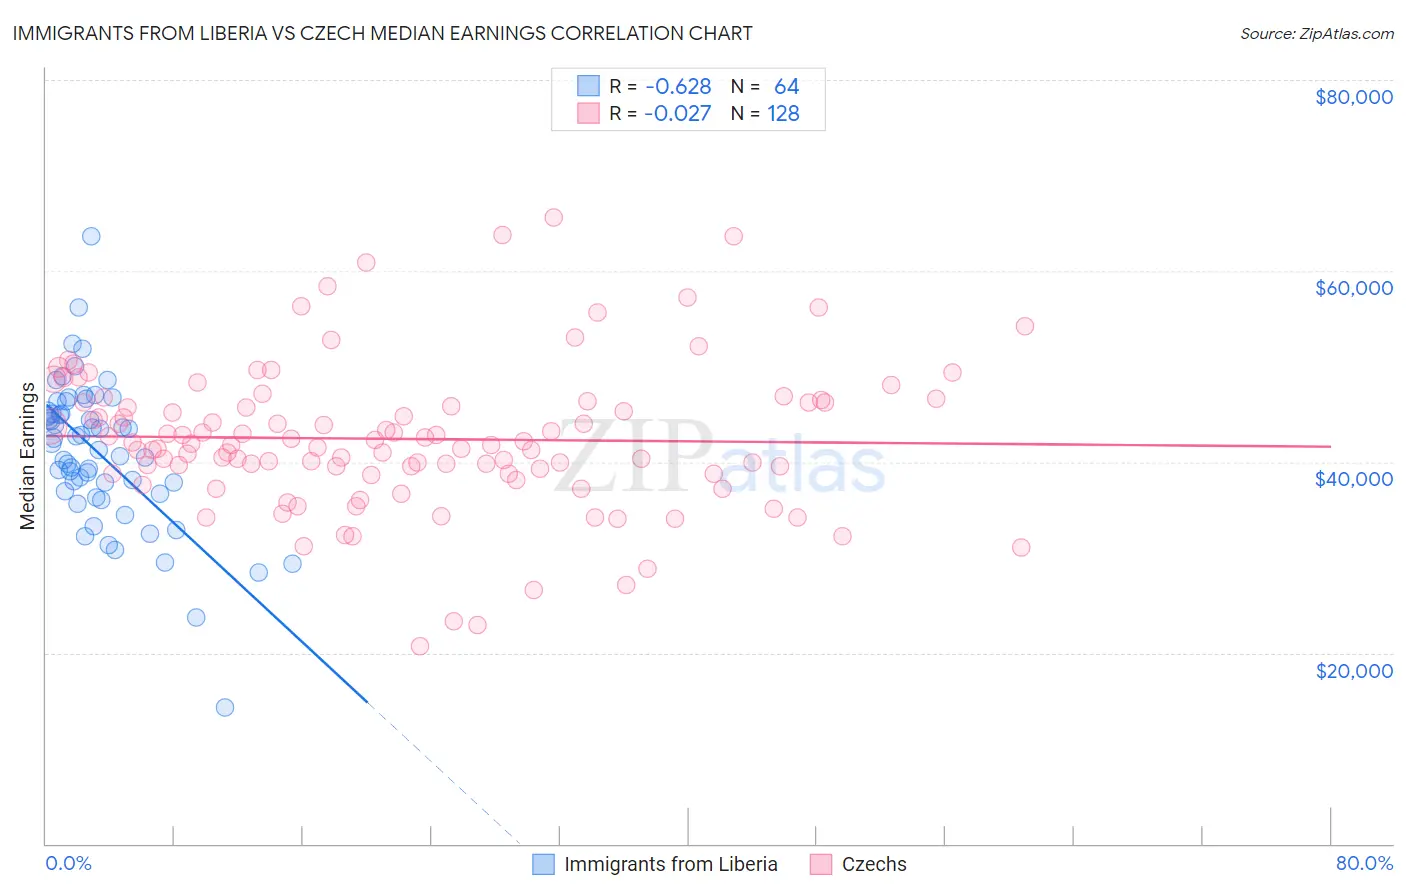
Immigrants from Liberia vs Czech Median Earnings Correlation Chart
The statistical analysis conducted on geographies consisting of 135,295,960 people shows a significant negative correlation between the proportion of Immigrants from Liberia and median earnings in the United States with a correlation coefficient (R) of -0.628 and weighted average of $42,923. Similarly, the statistical analysis conducted on geographies consisting of 484,720,536 people shows no correlation between the proportion of Czechs and median earnings in the United States with a correlation coefficient (R) of -0.027 and weighted average of $47,221, a difference of 10.0%.
Median Earnings Correlation Summary
| Measurement | Immigrants from Liberia | Czech |
| Minimum | $14,336 | $20,625 |
| Maximum | $63,608 | $65,656 |
| Range | $49,272 | $45,031 |
| Mean | $40,857 | $42,405 |
| Median | $41,575 | $41,812 |
| Interquartile 25% (IQ1) | $36,787 | $38,782 |
| Interquartile 75% (IQ3) | $45,056 | $46,266 |
| Interquartile Range (IQR) | $8,269 | $7,485 |
| Standard Deviation (Sample) | $7,722 | $7,742 |
| Standard Deviation (Population) | $7,661 | $7,712 |
Similar Demographics by Median Earnings
Demographics Similar to Immigrants from Liberia by Median Earnings
In terms of median earnings, the demographic groups most similar to Immigrants from Liberia are Salvadoran ($42,912, a difference of 0.030%), Immigrants from Laos ($42,884, a difference of 0.090%), Inupiat ($43,000, a difference of 0.18%), Immigrants from Jamaica ($43,026, a difference of 0.24%), and Nicaraguan ($43,026, a difference of 0.24%).
| Demographics | Rating | Rank | Median Earnings |
| Jamaicans | 1.3 /100 | #257 | Tragic $43,343 |
| French American Indians | 1.3 /100 | #258 | Tragic $43,333 |
| German Russians | 1.1 /100 | #259 | Tragic $43,200 |
| Immigrants | Somalia | 0.9 /100 | #260 | Tragic $43,100 |
| Immigrants | Jamaica | 0.8 /100 | #261 | Tragic $43,026 |
| Nicaraguans | 0.8 /100 | #262 | Tragic $43,026 |
| Inupiat | 0.8 /100 | #263 | Tragic $43,000 |
| Immigrants | Liberia | 0.7 /100 | #264 | Tragic $42,923 |
| Salvadorans | 0.7 /100 | #265 | Tragic $42,912 |
| Immigrants | Laos | 0.7 /100 | #266 | Tragic $42,884 |
| Cree | 0.6 /100 | #267 | Tragic $42,777 |
| Americans | 0.6 /100 | #268 | Tragic $42,742 |
| Belizeans | 0.5 /100 | #269 | Tragic $42,702 |
| Osage | 0.5 /100 | #270 | Tragic $42,651 |
| Pennsylvania Germans | 0.5 /100 | #271 | Tragic $42,615 |
Demographics Similar to Czechs by Median Earnings
In terms of median earnings, the demographic groups most similar to Czechs are Irish ($47,276, a difference of 0.12%), Immigrants from Vietnam ($47,282, a difference of 0.13%), Immigrants from Portugal ($47,304, a difference of 0.18%), Slovak ($47,095, a difference of 0.27%), and Immigrants from Peru ($47,025, a difference of 0.42%).
| Demographics | Rating | Rank | Median Earnings |
| Peruvians | 84.2 /100 | #150 | Excellent $47,628 |
| Immigrants | Oceania | 84.1 /100 | #151 | Excellent $47,617 |
| Immigrants | Germany | 83.1 /100 | #152 | Excellent $47,566 |
| Slavs | 81.1 /100 | #153 | Excellent $47,470 |
| Immigrants | Portugal | 77.3 /100 | #154 | Good $47,304 |
| Immigrants | Vietnam | 76.7 /100 | #155 | Good $47,282 |
| Irish | 76.6 /100 | #156 | Good $47,276 |
| Czechs | 75.1 /100 | #157 | Good $47,221 |
| Slovaks | 71.7 /100 | #158 | Good $47,095 |
| Immigrants | Peru | 69.6 /100 | #159 | Good $47,025 |
| Alsatians | 69.6 /100 | #160 | Good $47,023 |
| Immigrants | Eastern Africa | 68.0 /100 | #161 | Good $46,969 |
| South American Indians | 67.4 /100 | #162 | Good $46,952 |
| Icelanders | 66.3 /100 | #163 | Good $46,916 |
| Norwegians | 64.7 /100 | #164 | Good $46,865 |