Immigrants from Cuba vs Czech Median Earnings
COMPARE
Immigrants from Cuba
Czech
Median Earnings
Median Earnings Comparison
Immigrants from Cuba
Czechs
$38,426
MEDIAN EARNINGS
0.0/ 100
METRIC RATING
337th/ 347
METRIC RANK
$47,221
MEDIAN EARNINGS
75.1/ 100
METRIC RATING
157th/ 347
METRIC RANK
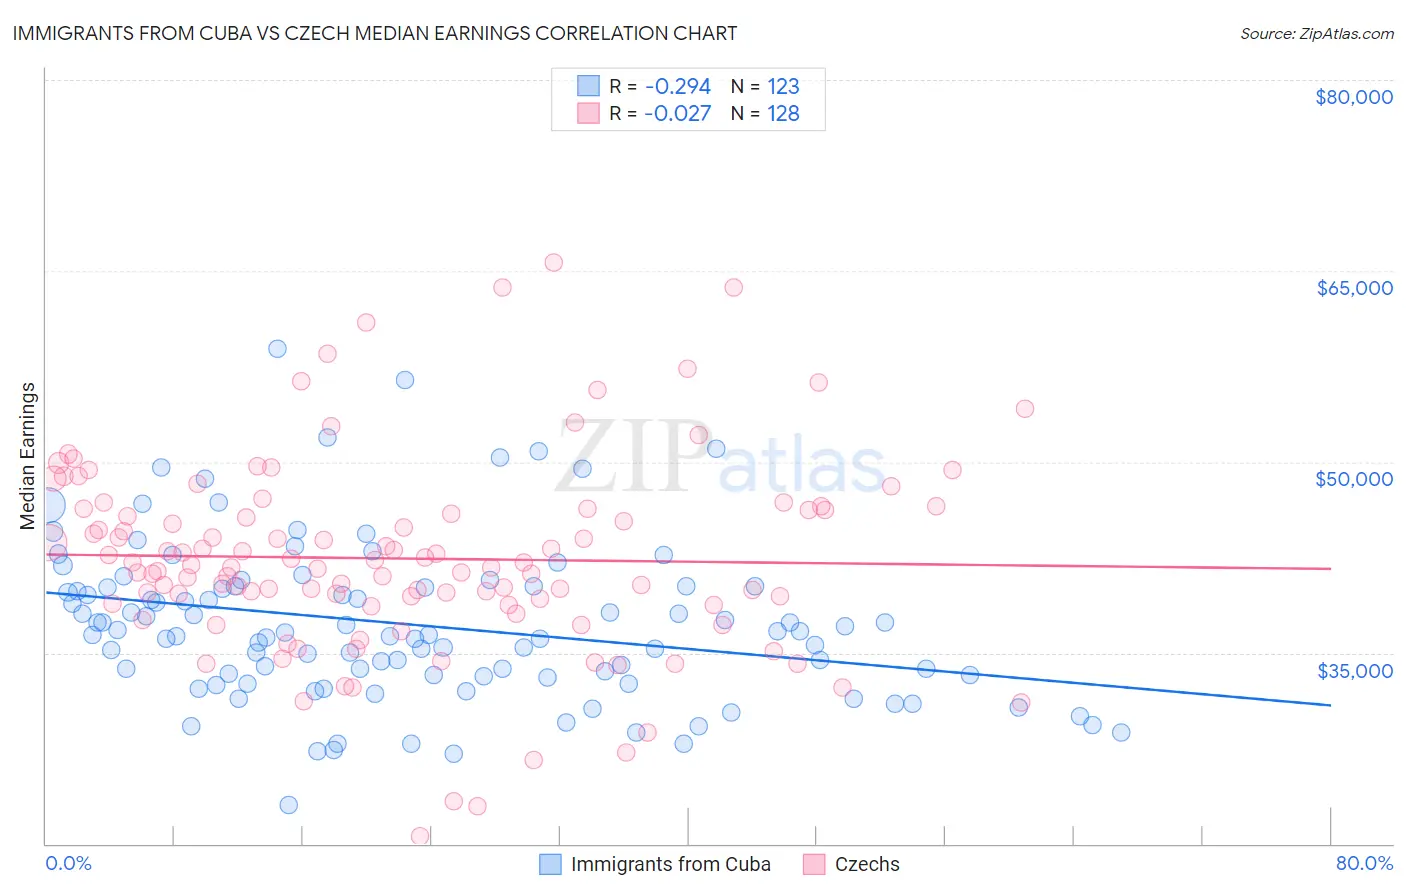
Immigrants from Cuba vs Czech Median Earnings Correlation Chart
The statistical analysis conducted on geographies consisting of 326,004,649 people shows a weak negative correlation between the proportion of Immigrants from Cuba and median earnings in the United States with a correlation coefficient (R) of -0.294 and weighted average of $38,426. Similarly, the statistical analysis conducted on geographies consisting of 484,720,536 people shows no correlation between the proportion of Czechs and median earnings in the United States with a correlation coefficient (R) of -0.027 and weighted average of $47,221, a difference of 22.9%.
Median Earnings Correlation Summary
| Measurement | Immigrants from Cuba | Czech |
| Minimum | $23,000 | $20,625 |
| Maximum | $58,885 | $65,656 |
| Range | $35,885 | $45,031 |
| Mean | $37,187 | $42,405 |
| Median | $36,411 | $41,812 |
| Interquartile 25% (IQ1) | $33,147 | $38,782 |
| Interquartile 75% (IQ3) | $40,226 | $46,266 |
| Interquartile Range (IQR) | $7,079 | $7,485 |
| Standard Deviation (Sample) | $6,277 | $7,742 |
| Standard Deviation (Population) | $6,251 | $7,712 |
Similar Demographics by Median Earnings
Demographics Similar to Immigrants from Cuba by Median Earnings
In terms of median earnings, the demographic groups most similar to Immigrants from Cuba are Pima ($38,285, a difference of 0.37%), Crow ($38,707, a difference of 0.73%), Native/Alaskan ($38,896, a difference of 1.2%), Spanish American Indian ($38,907, a difference of 1.3%), and Houma ($38,949, a difference of 1.4%).
| Demographics | Rating | Rank | Median Earnings |
| Immigrants | Congo | 0.0 /100 | #330 | Tragic $39,169 |
| Immigrants | Mexico | 0.0 /100 | #331 | Tragic $39,114 |
| Yakama | 0.0 /100 | #332 | Tragic $39,107 |
| Houma | 0.0 /100 | #333 | Tragic $38,949 |
| Spanish American Indians | 0.0 /100 | #334 | Tragic $38,907 |
| Natives/Alaskans | 0.0 /100 | #335 | Tragic $38,896 |
| Crow | 0.0 /100 | #336 | Tragic $38,707 |
| Immigrants | Cuba | 0.0 /100 | #337 | Tragic $38,426 |
| Pima | 0.0 /100 | #338 | Tragic $38,285 |
| Menominee | 0.0 /100 | #339 | Tragic $37,884 |
| Navajo | 0.0 /100 | #340 | Tragic $36,999 |
| Lumbee | 0.0 /100 | #341 | Tragic $36,876 |
| Hopi | 0.0 /100 | #342 | Tragic $36,871 |
| Pueblo | 0.0 /100 | #343 | Tragic $36,859 |
| Arapaho | 0.0 /100 | #344 | Tragic $36,586 |
Demographics Similar to Czechs by Median Earnings
In terms of median earnings, the demographic groups most similar to Czechs are Irish ($47,276, a difference of 0.12%), Immigrants from Vietnam ($47,282, a difference of 0.13%), Immigrants from Portugal ($47,304, a difference of 0.18%), Slovak ($47,095, a difference of 0.27%), and Immigrants from Peru ($47,025, a difference of 0.42%).
| Demographics | Rating | Rank | Median Earnings |
| Peruvians | 84.2 /100 | #150 | Excellent $47,628 |
| Immigrants | Oceania | 84.1 /100 | #151 | Excellent $47,617 |
| Immigrants | Germany | 83.1 /100 | #152 | Excellent $47,566 |
| Slavs | 81.1 /100 | #153 | Excellent $47,470 |
| Immigrants | Portugal | 77.3 /100 | #154 | Good $47,304 |
| Immigrants | Vietnam | 76.7 /100 | #155 | Good $47,282 |
| Irish | 76.6 /100 | #156 | Good $47,276 |
| Czechs | 75.1 /100 | #157 | Good $47,221 |
| Slovaks | 71.7 /100 | #158 | Good $47,095 |
| Immigrants | Peru | 69.6 /100 | #159 | Good $47,025 |
| Alsatians | 69.6 /100 | #160 | Good $47,023 |
| Immigrants | Eastern Africa | 68.0 /100 | #161 | Good $46,969 |
| South American Indians | 67.4 /100 | #162 | Good $46,952 |
| Icelanders | 66.3 /100 | #163 | Good $46,916 |
| Norwegians | 64.7 /100 | #164 | Good $46,865 |