Celtic vs Czech Median Earnings
COMPARE
Celtic
Czech
Median Earnings
Median Earnings Comparison
Celtics
Czechs
$45,732
MEDIAN EARNINGS
27.2/ 100
METRIC RATING
201st/ 347
METRIC RANK
$47,221
MEDIAN EARNINGS
75.1/ 100
METRIC RATING
157th/ 347
METRIC RANK
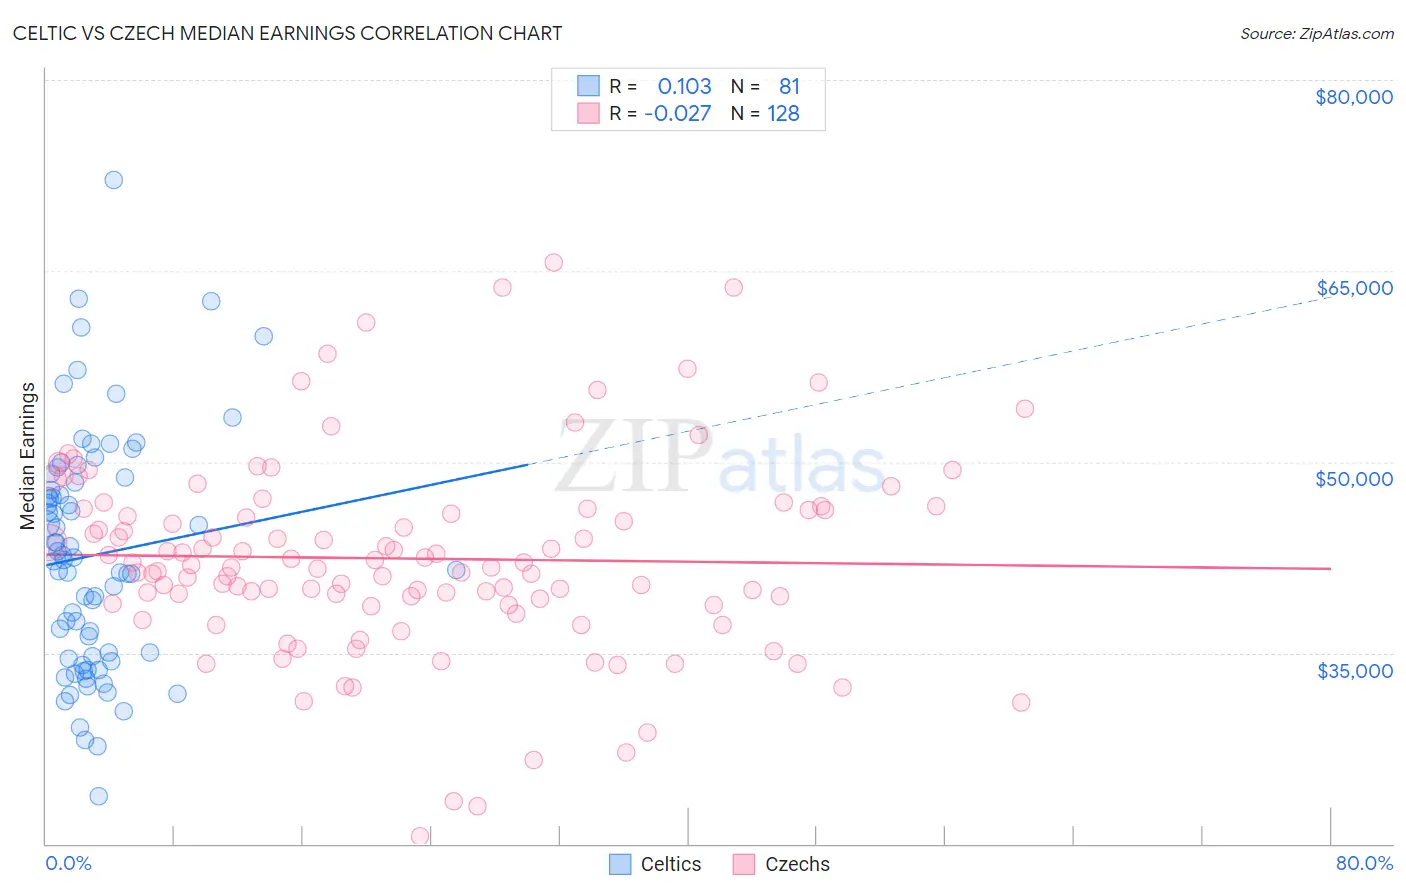
Celtic vs Czech Median Earnings Correlation Chart
The statistical analysis conducted on geographies consisting of 168,867,558 people shows a poor positive correlation between the proportion of Celtics and median earnings in the United States with a correlation coefficient (R) of 0.103 and weighted average of $45,732. Similarly, the statistical analysis conducted on geographies consisting of 484,720,536 people shows no correlation between the proportion of Czechs and median earnings in the United States with a correlation coefficient (R) of -0.027 and weighted average of $47,221, a difference of 3.3%.
Median Earnings Correlation Summary
| Measurement | Celtic | Czech |
| Minimum | $23,710 | $20,625 |
| Maximum | $72,162 | $65,656 |
| Range | $48,452 | $45,031 |
| Mean | $42,685 | $42,405 |
| Median | $42,318 | $41,812 |
| Interquartile 25% (IQ1) | $34,608 | $38,782 |
| Interquartile 75% (IQ3) | $48,561 | $46,266 |
| Interquartile Range (IQR) | $13,953 | $7,485 |
| Standard Deviation (Sample) | $9,238 | $7,742 |
| Standard Deviation (Population) | $9,181 | $7,712 |
Similar Demographics by Median Earnings
Demographics Similar to Celtics by Median Earnings
In terms of median earnings, the demographic groups most similar to Celtics are Immigrants from Trinidad and Tobago ($45,729, a difference of 0.010%), Welsh ($45,710, a difference of 0.050%), Immigrants from Uruguay ($45,682, a difference of 0.11%), Tongan ($45,665, a difference of 0.15%), and Immigrants from Barbados ($45,816, a difference of 0.18%).
| Demographics | Rating | Rank | Median Earnings |
| Immigrants | Costa Rica | 33.0 /100 | #194 | Fair $45,928 |
| Immigrants | St. Vincent and the Grenadines | 32.4 /100 | #195 | Fair $45,908 |
| Yugoslavians | 30.5 /100 | #196 | Fair $45,846 |
| Barbadians | 30.5 /100 | #197 | Fair $45,846 |
| Trinidadians and Tobagonians | 29.7 /100 | #198 | Fair $45,820 |
| Immigrants | Barbados | 29.6 /100 | #199 | Fair $45,816 |
| Immigrants | Azores | 29.5 /100 | #200 | Fair $45,812 |
| Celtics | 27.2 /100 | #201 | Fair $45,732 |
| Immigrants | Trinidad and Tobago | 27.1 /100 | #202 | Fair $45,729 |
| Welsh | 26.6 /100 | #203 | Fair $45,710 |
| Immigrants | Uruguay | 25.9 /100 | #204 | Fair $45,682 |
| Tongans | 25.4 /100 | #205 | Fair $45,665 |
| Immigrants | Ghana | 24.8 /100 | #206 | Fair $45,641 |
| Immigrants | Senegal | 24.0 /100 | #207 | Fair $45,611 |
| Immigrants | Bosnia and Herzegovina | 23.7 /100 | #208 | Fair $45,600 |
Demographics Similar to Czechs by Median Earnings
In terms of median earnings, the demographic groups most similar to Czechs are Irish ($47,276, a difference of 0.12%), Immigrants from Vietnam ($47,282, a difference of 0.13%), Immigrants from Portugal ($47,304, a difference of 0.18%), Slovak ($47,095, a difference of 0.27%), and Immigrants from Peru ($47,025, a difference of 0.42%).
| Demographics | Rating | Rank | Median Earnings |
| Peruvians | 84.2 /100 | #150 | Excellent $47,628 |
| Immigrants | Oceania | 84.1 /100 | #151 | Excellent $47,617 |
| Immigrants | Germany | 83.1 /100 | #152 | Excellent $47,566 |
| Slavs | 81.1 /100 | #153 | Excellent $47,470 |
| Immigrants | Portugal | 77.3 /100 | #154 | Good $47,304 |
| Immigrants | Vietnam | 76.7 /100 | #155 | Good $47,282 |
| Irish | 76.6 /100 | #156 | Good $47,276 |
| Czechs | 75.1 /100 | #157 | Good $47,221 |
| Slovaks | 71.7 /100 | #158 | Good $47,095 |
| Immigrants | Peru | 69.6 /100 | #159 | Good $47,025 |
| Alsatians | 69.6 /100 | #160 | Good $47,023 |
| Immigrants | Eastern Africa | 68.0 /100 | #161 | Good $46,969 |
| South American Indians | 67.4 /100 | #162 | Good $46,952 |
| Icelanders | 66.3 /100 | #163 | Good $46,916 |
| Norwegians | 64.7 /100 | #164 | Good $46,865 |