British vs Czech Median Earnings
COMPARE
British
Czech
Median Earnings
Median Earnings Comparison
British
Czechs
$48,189
MEDIAN EARNINGS
92.2/ 100
METRIC RATING
132nd/ 347
METRIC RANK
$47,221
MEDIAN EARNINGS
75.1/ 100
METRIC RATING
157th/ 347
METRIC RANK
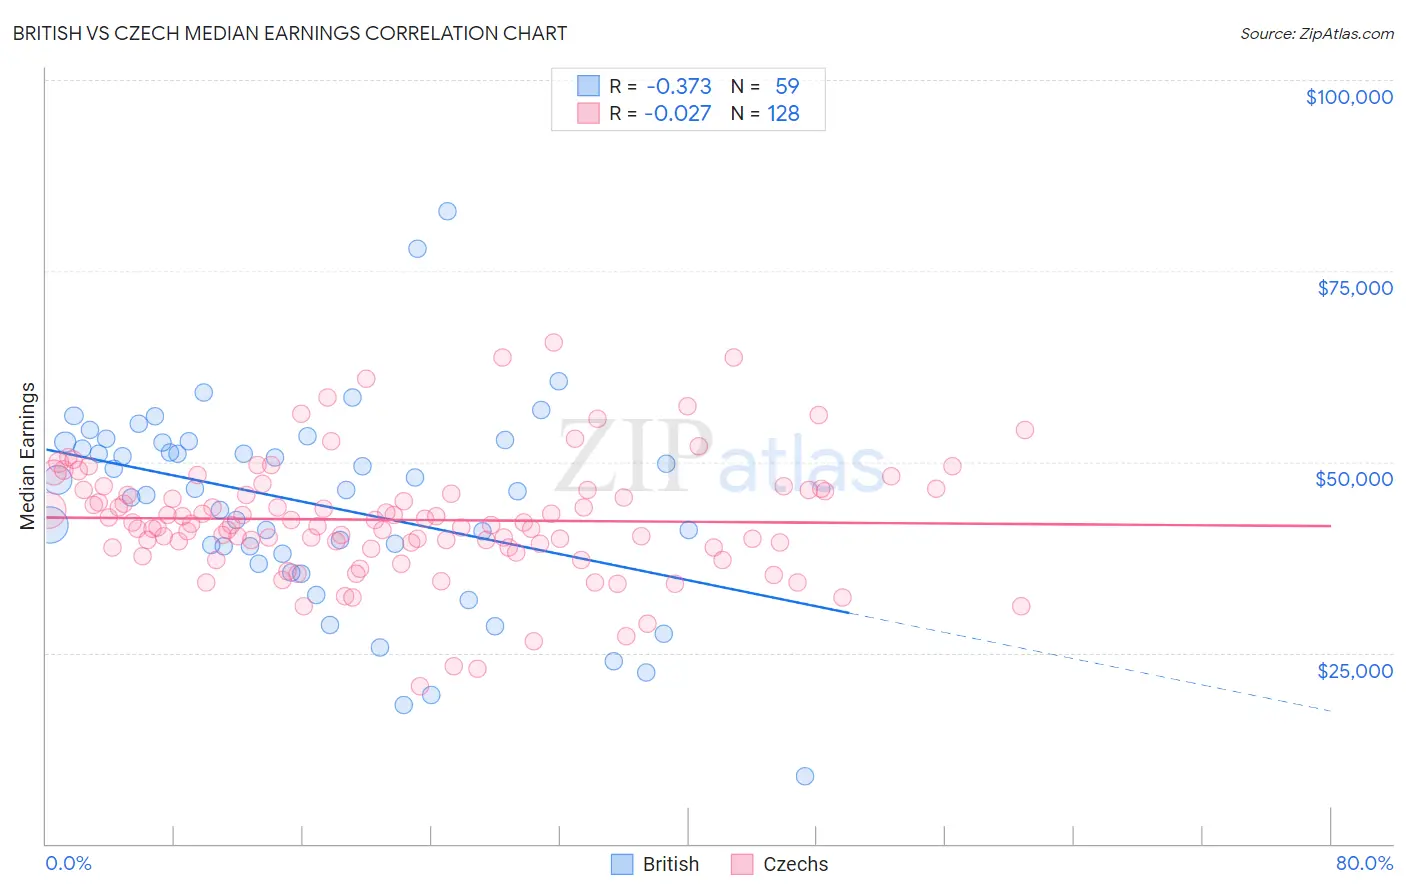
British vs Czech Median Earnings Correlation Chart
The statistical analysis conducted on geographies consisting of 531,344,409 people shows a mild negative correlation between the proportion of British and median earnings in the United States with a correlation coefficient (R) of -0.373 and weighted average of $48,189. Similarly, the statistical analysis conducted on geographies consisting of 484,720,536 people shows no correlation between the proportion of Czechs and median earnings in the United States with a correlation coefficient (R) of -0.027 and weighted average of $47,221, a difference of 2.1%.
Median Earnings Correlation Summary
| Measurement | British | Czech |
| Minimum | $8,915 | $20,625 |
| Maximum | $82,773 | $65,656 |
| Range | $73,858 | $45,031 |
| Mean | $44,491 | $42,405 |
| Median | $46,291 | $41,812 |
| Interquartile 25% (IQ1) | $37,889 | $38,782 |
| Interquartile 75% (IQ3) | $52,582 | $46,266 |
| Interquartile Range (IQR) | $14,693 | $7,485 |
| Standard Deviation (Sample) | $13,191 | $7,742 |
| Standard Deviation (Population) | $13,079 | $7,712 |
Similar Demographics by Median Earnings
Demographics Similar to British by Median Earnings
In terms of median earnings, the demographic groups most similar to British are Zimbabwean ($48,229, a difference of 0.080%), Lebanese ($48,226, a difference of 0.080%), Pakistani ($48,254, a difference of 0.14%), Immigrants from Philippines ($48,266, a difference of 0.16%), and Sierra Leonean ($48,286, a difference of 0.20%).
| Demographics | Rating | Rank | Median Earnings |
| Immigrants | Fiji | 93.3 /100 | #125 | Exceptional $48,305 |
| Assyrians/Chaldeans/Syriacs | 93.3 /100 | #126 | Exceptional $48,304 |
| Sierra Leoneans | 93.1 /100 | #127 | Exceptional $48,286 |
| Immigrants | Philippines | 92.9 /100 | #128 | Exceptional $48,266 |
| Pakistanis | 92.8 /100 | #129 | Exceptional $48,254 |
| Zimbabweans | 92.6 /100 | #130 | Exceptional $48,229 |
| Lebanese | 92.5 /100 | #131 | Exceptional $48,226 |
| British | 92.2 /100 | #132 | Exceptional $48,189 |
| Immigrants | Uganda | 90.5 /100 | #133 | Exceptional $48,041 |
| Sri Lankans | 90.5 /100 | #134 | Exceptional $48,040 |
| Portuguese | 90.4 /100 | #135 | Exceptional $48,032 |
| Slovenes | 90.0 /100 | #136 | Excellent $47,995 |
| Immigrants | Nepal | 89.0 /100 | #137 | Excellent $47,925 |
| Europeans | 88.9 /100 | #138 | Excellent $47,915 |
| Canadians | 88.8 /100 | #139 | Excellent $47,911 |
Demographics Similar to Czechs by Median Earnings
In terms of median earnings, the demographic groups most similar to Czechs are Irish ($47,276, a difference of 0.12%), Immigrants from Vietnam ($47,282, a difference of 0.13%), Immigrants from Portugal ($47,304, a difference of 0.18%), Slovak ($47,095, a difference of 0.27%), and Immigrants from Peru ($47,025, a difference of 0.42%).
| Demographics | Rating | Rank | Median Earnings |
| Peruvians | 84.2 /100 | #150 | Excellent $47,628 |
| Immigrants | Oceania | 84.1 /100 | #151 | Excellent $47,617 |
| Immigrants | Germany | 83.1 /100 | #152 | Excellent $47,566 |
| Slavs | 81.1 /100 | #153 | Excellent $47,470 |
| Immigrants | Portugal | 77.3 /100 | #154 | Good $47,304 |
| Immigrants | Vietnam | 76.7 /100 | #155 | Good $47,282 |
| Irish | 76.6 /100 | #156 | Good $47,276 |
| Czechs | 75.1 /100 | #157 | Good $47,221 |
| Slovaks | 71.7 /100 | #158 | Good $47,095 |
| Immigrants | Peru | 69.6 /100 | #159 | Good $47,025 |
| Alsatians | 69.6 /100 | #160 | Good $47,023 |
| Immigrants | Eastern Africa | 68.0 /100 | #161 | Good $46,969 |
| South American Indians | 67.4 /100 | #162 | Good $46,952 |
| Icelanders | 66.3 /100 | #163 | Good $46,916 |
| Norwegians | 64.7 /100 | #164 | Good $46,865 |