Polish vs Czech Median Earnings
COMPARE
Polish
Czech
Median Earnings
Median Earnings Comparison
Poles
Czechs
$48,659
MEDIAN EARNINGS
95.8/ 100
METRIC RATING
119th/ 347
METRIC RANK
$47,221
MEDIAN EARNINGS
75.1/ 100
METRIC RATING
157th/ 347
METRIC RANK
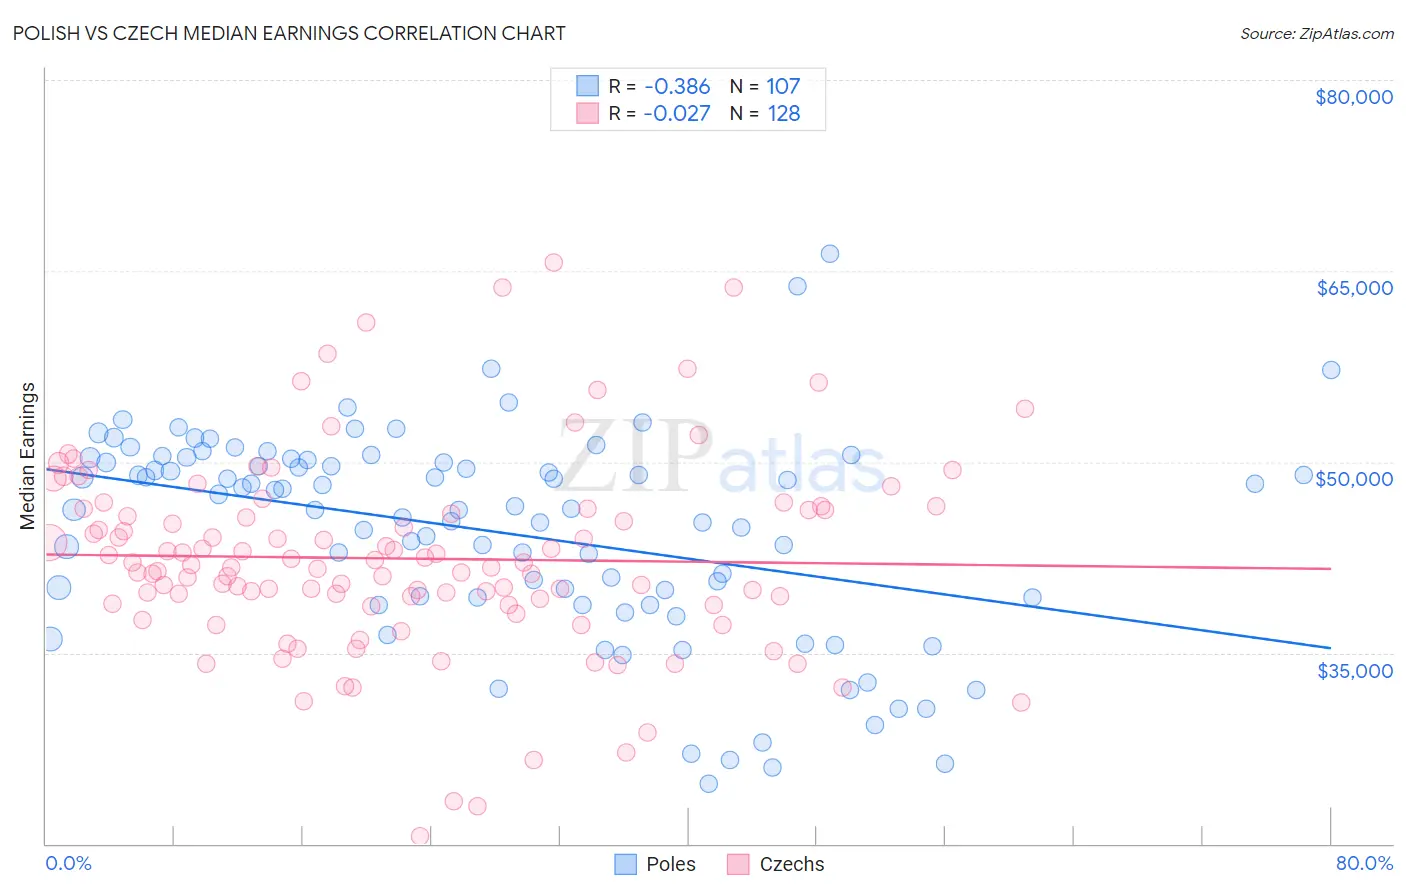
Polish vs Czech Median Earnings Correlation Chart
The statistical analysis conducted on geographies consisting of 560,312,185 people shows a mild negative correlation between the proportion of Poles and median earnings in the United States with a correlation coefficient (R) of -0.386 and weighted average of $48,659. Similarly, the statistical analysis conducted on geographies consisting of 484,720,536 people shows no correlation between the proportion of Czechs and median earnings in the United States with a correlation coefficient (R) of -0.027 and weighted average of $47,221, a difference of 3.0%.
Median Earnings Correlation Summary
| Measurement | Polish | Czech |
| Minimum | $24,750 | $20,625 |
| Maximum | $66,354 | $65,656 |
| Range | $41,604 | $45,031 |
| Mean | $44,491 | $42,405 |
| Median | $46,283 | $41,812 |
| Interquartile 25% (IQ1) | $39,299 | $38,782 |
| Interquartile 75% (IQ3) | $50,191 | $46,266 |
| Interquartile Range (IQR) | $10,892 | $7,485 |
| Standard Deviation (Sample) | $8,192 | $7,742 |
| Standard Deviation (Population) | $8,153 | $7,712 |
Similar Demographics by Median Earnings
Demographics Similar to Poles by Median Earnings
In terms of median earnings, the demographic groups most similar to Poles are Immigrants from Jordan ($48,673, a difference of 0.030%), Serbian ($48,677, a difference of 0.040%), Carpatho Rusyn ($48,617, a difference of 0.080%), Arab ($48,599, a difference of 0.12%), and Korean ($48,727, a difference of 0.14%).
| Demographics | Rating | Rank | Median Earnings |
| Northern Europeans | 96.9 /100 | #112 | Exceptional $48,887 |
| Immigrants | Kuwait | 96.8 /100 | #113 | Exceptional $48,861 |
| Moroccans | 96.7 /100 | #114 | Exceptional $48,838 |
| Chinese | 96.7 /100 | #115 | Exceptional $48,836 |
| Koreans | 96.2 /100 | #116 | Exceptional $48,727 |
| Serbians | 95.9 /100 | #117 | Exceptional $48,677 |
| Immigrants | Jordan | 95.9 /100 | #118 | Exceptional $48,673 |
| Poles | 95.8 /100 | #119 | Exceptional $48,659 |
| Carpatho Rusyns | 95.5 /100 | #120 | Exceptional $48,617 |
| Arabs | 95.4 /100 | #121 | Exceptional $48,599 |
| Chileans | 94.8 /100 | #122 | Exceptional $48,504 |
| Immigrants | Syria | 93.9 /100 | #123 | Exceptional $48,375 |
| Brazilians | 93.7 /100 | #124 | Exceptional $48,356 |
| Immigrants | Fiji | 93.3 /100 | #125 | Exceptional $48,305 |
| Assyrians/Chaldeans/Syriacs | 93.3 /100 | #126 | Exceptional $48,304 |
Demographics Similar to Czechs by Median Earnings
In terms of median earnings, the demographic groups most similar to Czechs are Irish ($47,276, a difference of 0.12%), Immigrants from Vietnam ($47,282, a difference of 0.13%), Immigrants from Portugal ($47,304, a difference of 0.18%), Slovak ($47,095, a difference of 0.27%), and Immigrants from Peru ($47,025, a difference of 0.42%).
| Demographics | Rating | Rank | Median Earnings |
| Peruvians | 84.2 /100 | #150 | Excellent $47,628 |
| Immigrants | Oceania | 84.1 /100 | #151 | Excellent $47,617 |
| Immigrants | Germany | 83.1 /100 | #152 | Excellent $47,566 |
| Slavs | 81.1 /100 | #153 | Excellent $47,470 |
| Immigrants | Portugal | 77.3 /100 | #154 | Good $47,304 |
| Immigrants | Vietnam | 76.7 /100 | #155 | Good $47,282 |
| Irish | 76.6 /100 | #156 | Good $47,276 |
| Czechs | 75.1 /100 | #157 | Good $47,221 |
| Slovaks | 71.7 /100 | #158 | Good $47,095 |
| Immigrants | Peru | 69.6 /100 | #159 | Good $47,025 |
| Alsatians | 69.6 /100 | #160 | Good $47,023 |
| Immigrants | Eastern Africa | 68.0 /100 | #161 | Good $46,969 |
| South American Indians | 67.4 /100 | #162 | Good $46,952 |
| Icelanders | 66.3 /100 | #163 | Good $46,916 |
| Norwegians | 64.7 /100 | #164 | Good $46,865 |