Burmese vs Czech Median Earnings
COMPARE
Burmese
Czech
Median Earnings
Median Earnings Comparison
Burmese
Czechs
$54,559
MEDIAN EARNINGS
100.0/ 100
METRIC RATING
21st/ 347
METRIC RANK
$47,221
MEDIAN EARNINGS
75.1/ 100
METRIC RATING
157th/ 347
METRIC RANK
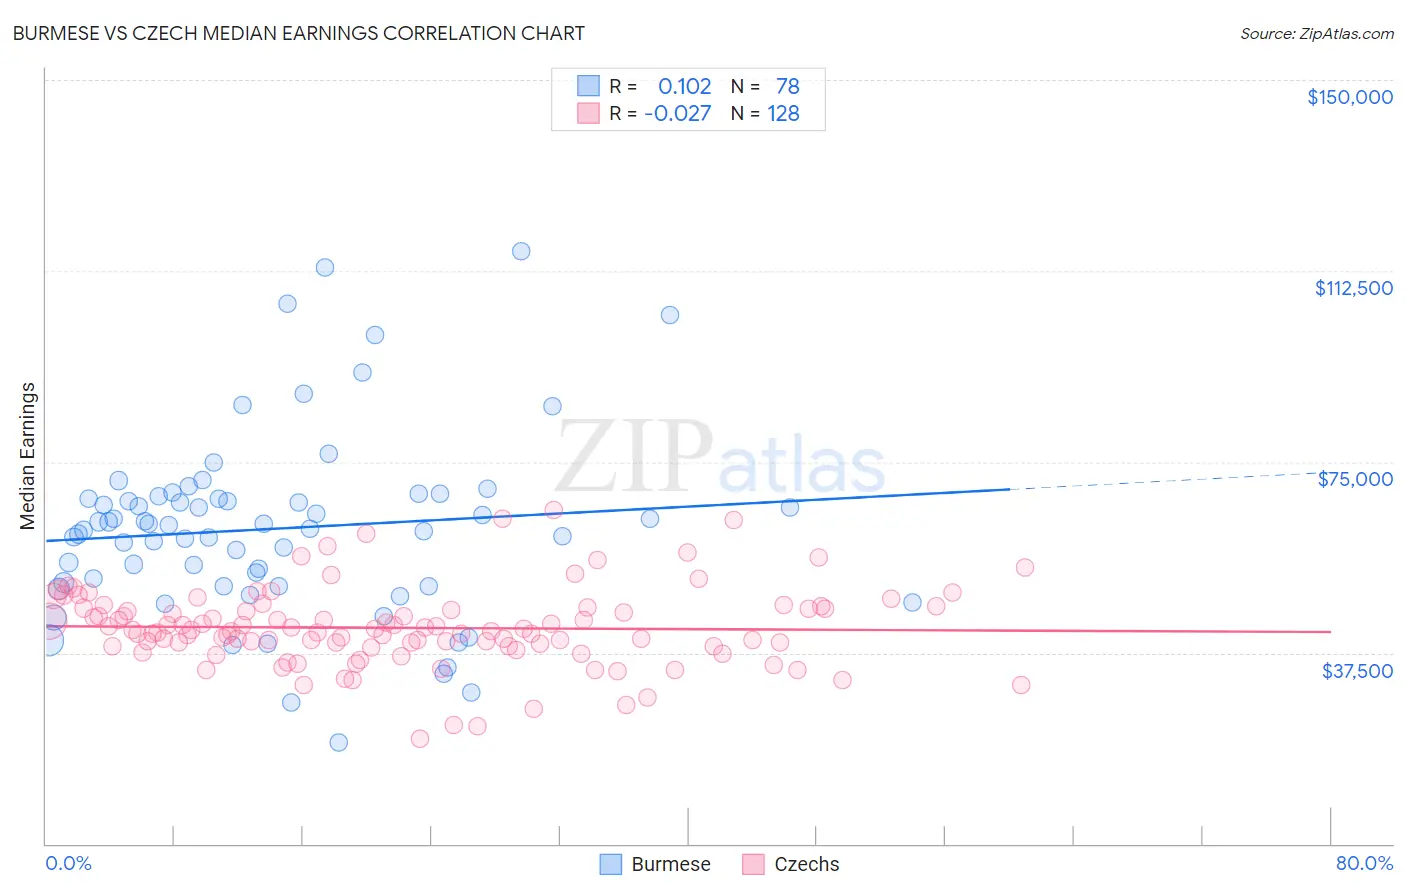
Burmese vs Czech Median Earnings Correlation Chart
The statistical analysis conducted on geographies consisting of 465,399,641 people shows a poor positive correlation between the proportion of Burmese and median earnings in the United States with a correlation coefficient (R) of 0.102 and weighted average of $54,559. Similarly, the statistical analysis conducted on geographies consisting of 484,720,536 people shows no correlation between the proportion of Czechs and median earnings in the United States with a correlation coefficient (R) of -0.027 and weighted average of $47,221, a difference of 15.5%.
Median Earnings Correlation Summary
| Measurement | Burmese | Czech |
| Minimum | $20,000 | $20,625 |
| Maximum | $116,380 | $65,656 |
| Range | $96,380 | $45,031 |
| Mean | $61,901 | $42,405 |
| Median | $62,283 | $41,812 |
| Interquartile 25% (IQ1) | $50,678 | $38,782 |
| Interquartile 75% (IQ3) | $67,756 | $46,266 |
| Interquartile Range (IQR) | $17,078 | $7,485 |
| Standard Deviation (Sample) | $18,078 | $7,742 |
| Standard Deviation (Population) | $17,962 | $7,712 |
Similar Demographics by Median Earnings
Demographics Similar to Burmese by Median Earnings
In terms of median earnings, the demographic groups most similar to Burmese are Immigrants from Korea ($54,530, a difference of 0.050%), Cypriot ($54,589, a difference of 0.060%), Immigrants from Sweden ($54,478, a difference of 0.15%), Immigrants from Belgium ($54,679, a difference of 0.22%), and Soviet Union ($54,290, a difference of 0.50%).
| Demographics | Rating | Rank | Median Earnings |
| Immigrants | Australia | 100.0 /100 | #14 | Exceptional $56,305 |
| Indians (Asian) | 100.0 /100 | #15 | Exceptional $56,253 |
| Immigrants | Eastern Asia | 100.0 /100 | #16 | Exceptional $56,183 |
| Eastern Europeans | 100.0 /100 | #17 | Exceptional $55,084 |
| Immigrants | Japan | 100.0 /100 | #18 | Exceptional $54,938 |
| Immigrants | Belgium | 100.0 /100 | #19 | Exceptional $54,679 |
| Cypriots | 100.0 /100 | #20 | Exceptional $54,589 |
| Burmese | 100.0 /100 | #21 | Exceptional $54,559 |
| Immigrants | Korea | 100.0 /100 | #22 | Exceptional $54,530 |
| Immigrants | Sweden | 100.0 /100 | #23 | Exceptional $54,478 |
| Soviet Union | 100.0 /100 | #24 | Exceptional $54,290 |
| Turks | 100.0 /100 | #25 | Exceptional $53,919 |
| Immigrants | Northern Europe | 100.0 /100 | #26 | Exceptional $53,872 |
| Asians | 100.0 /100 | #27 | Exceptional $53,690 |
| Immigrants | France | 100.0 /100 | #28 | Exceptional $53,490 |
Demographics Similar to Czechs by Median Earnings
In terms of median earnings, the demographic groups most similar to Czechs are Irish ($47,276, a difference of 0.12%), Immigrants from Vietnam ($47,282, a difference of 0.13%), Immigrants from Portugal ($47,304, a difference of 0.18%), Slovak ($47,095, a difference of 0.27%), and Immigrants from Peru ($47,025, a difference of 0.42%).
| Demographics | Rating | Rank | Median Earnings |
| Peruvians | 84.2 /100 | #150 | Excellent $47,628 |
| Immigrants | Oceania | 84.1 /100 | #151 | Excellent $47,617 |
| Immigrants | Germany | 83.1 /100 | #152 | Excellent $47,566 |
| Slavs | 81.1 /100 | #153 | Excellent $47,470 |
| Immigrants | Portugal | 77.3 /100 | #154 | Good $47,304 |
| Immigrants | Vietnam | 76.7 /100 | #155 | Good $47,282 |
| Irish | 76.6 /100 | #156 | Good $47,276 |
| Czechs | 75.1 /100 | #157 | Good $47,221 |
| Slovaks | 71.7 /100 | #158 | Good $47,095 |
| Immigrants | Peru | 69.6 /100 | #159 | Good $47,025 |
| Alsatians | 69.6 /100 | #160 | Good $47,023 |
| Immigrants | Eastern Africa | 68.0 /100 | #161 | Good $46,969 |
| South American Indians | 67.4 /100 | #162 | Good $46,952 |
| Icelanders | 66.3 /100 | #163 | Good $46,916 |
| Norwegians | 64.7 /100 | #164 | Good $46,865 |