Immigrants from Spain vs Czech Median Earnings
COMPARE
Immigrants from Spain
Czech
Median Earnings
Median Earnings Comparison
Immigrants from Spain
Czechs
$51,092
MEDIAN EARNINGS
99.9/ 100
METRIC RATING
67th/ 347
METRIC RANK
$47,221
MEDIAN EARNINGS
75.1/ 100
METRIC RATING
157th/ 347
METRIC RANK
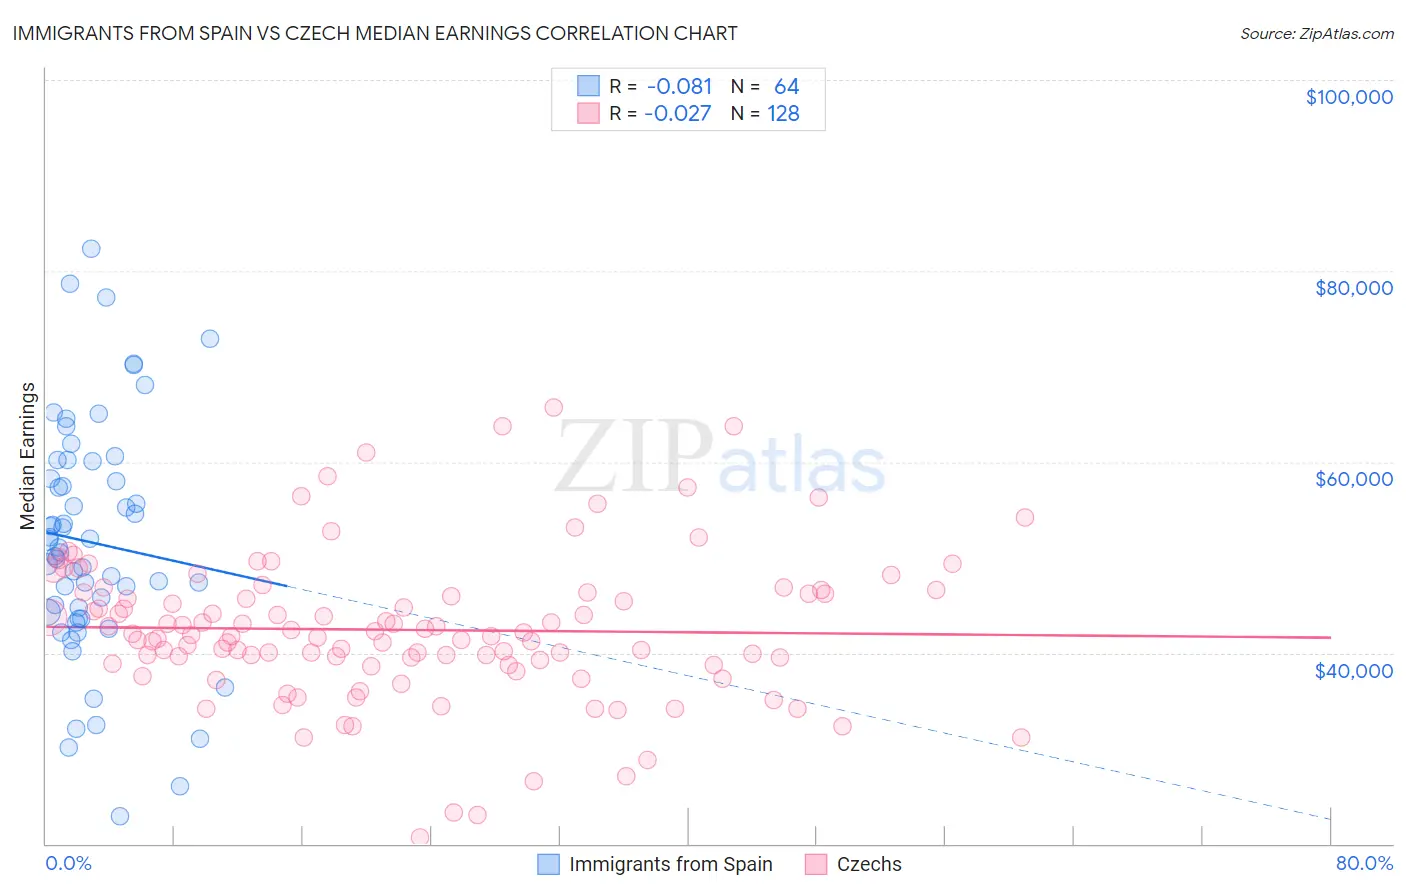
Immigrants from Spain vs Czech Median Earnings Correlation Chart
The statistical analysis conducted on geographies consisting of 239,665,603 people shows a slight negative correlation between the proportion of Immigrants from Spain and median earnings in the United States with a correlation coefficient (R) of -0.081 and weighted average of $51,092. Similarly, the statistical analysis conducted on geographies consisting of 484,720,536 people shows no correlation between the proportion of Czechs and median earnings in the United States with a correlation coefficient (R) of -0.027 and weighted average of $47,221, a difference of 8.2%.
Median Earnings Correlation Summary
| Measurement | Immigrants from Spain | Czech |
| Minimum | $22,920 | $20,625 |
| Maximum | $82,356 | $65,656 |
| Range | $59,436 | $45,031 |
| Mean | $51,542 | $42,405 |
| Median | $50,726 | $41,812 |
| Interquartile 25% (IQ1) | $43,899 | $38,782 |
| Interquartile 75% (IQ3) | $59,167 | $46,266 |
| Interquartile Range (IQR) | $15,268 | $7,485 |
| Standard Deviation (Sample) | $12,392 | $7,742 |
| Standard Deviation (Population) | $12,295 | $7,712 |
Similar Demographics by Median Earnings
Demographics Similar to Immigrants from Spain by Median Earnings
In terms of median earnings, the demographic groups most similar to Immigrants from Spain are Afghan ($51,112, a difference of 0.040%), Paraguayan ($51,068, a difference of 0.050%), Mongolian ($51,038, a difference of 0.11%), Greek ($51,164, a difference of 0.14%), and Lithuanian ($50,991, a difference of 0.20%).
| Demographics | Rating | Rank | Median Earnings |
| Immigrants | Serbia | 99.9 /100 | #60 | Exceptional $51,557 |
| Immigrants | Latvia | 99.9 /100 | #61 | Exceptional $51,555 |
| Immigrants | Romania | 99.9 /100 | #62 | Exceptional $51,337 |
| Immigrants | Bulgaria | 99.9 /100 | #63 | Exceptional $51,318 |
| New Zealanders | 99.9 /100 | #64 | Exceptional $51,246 |
| Greeks | 99.9 /100 | #65 | Exceptional $51,164 |
| Afghans | 99.9 /100 | #66 | Exceptional $51,112 |
| Immigrants | Spain | 99.9 /100 | #67 | Exceptional $51,092 |
| Paraguayans | 99.9 /100 | #68 | Exceptional $51,068 |
| Mongolians | 99.8 /100 | #69 | Exceptional $51,038 |
| Lithuanians | 99.8 /100 | #70 | Exceptional $50,991 |
| Immigrants | Ukraine | 99.8 /100 | #71 | Exceptional $50,984 |
| Immigrants | Egypt | 99.8 /100 | #72 | Exceptional $50,901 |
| Immigrants | Netherlands | 99.8 /100 | #73 | Exceptional $50,818 |
| South Africans | 99.8 /100 | #74 | Exceptional $50,752 |
Demographics Similar to Czechs by Median Earnings
In terms of median earnings, the demographic groups most similar to Czechs are Irish ($47,276, a difference of 0.12%), Immigrants from Vietnam ($47,282, a difference of 0.13%), Immigrants from Portugal ($47,304, a difference of 0.18%), Slovak ($47,095, a difference of 0.27%), and Immigrants from Peru ($47,025, a difference of 0.42%).
| Demographics | Rating | Rank | Median Earnings |
| Peruvians | 84.2 /100 | #150 | Excellent $47,628 |
| Immigrants | Oceania | 84.1 /100 | #151 | Excellent $47,617 |
| Immigrants | Germany | 83.1 /100 | #152 | Excellent $47,566 |
| Slavs | 81.1 /100 | #153 | Excellent $47,470 |
| Immigrants | Portugal | 77.3 /100 | #154 | Good $47,304 |
| Immigrants | Vietnam | 76.7 /100 | #155 | Good $47,282 |
| Irish | 76.6 /100 | #156 | Good $47,276 |
| Czechs | 75.1 /100 | #157 | Good $47,221 |
| Slovaks | 71.7 /100 | #158 | Good $47,095 |
| Immigrants | Peru | 69.6 /100 | #159 | Good $47,025 |
| Alsatians | 69.6 /100 | #160 | Good $47,023 |
| Immigrants | Eastern Africa | 68.0 /100 | #161 | Good $46,969 |
| South American Indians | 67.4 /100 | #162 | Good $46,952 |
| Icelanders | 66.3 /100 | #163 | Good $46,916 |
| Norwegians | 64.7 /100 | #164 | Good $46,865 |