Choctaw vs Immigrants from Eritrea Median Female Earnings
COMPARE
Choctaw
Immigrants from Eritrea
Median Female Earnings
Median Female Earnings Comparison
Choctaw
Immigrants from Eritrea
$33,775
MEDIAN FEMALE EARNINGS
0.0/ 100
METRIC RATING
332nd/ 347
METRIC RANK
$41,485
MEDIAN FEMALE EARNINGS
97.6/ 100
METRIC RATING
106th/ 347
METRIC RANK
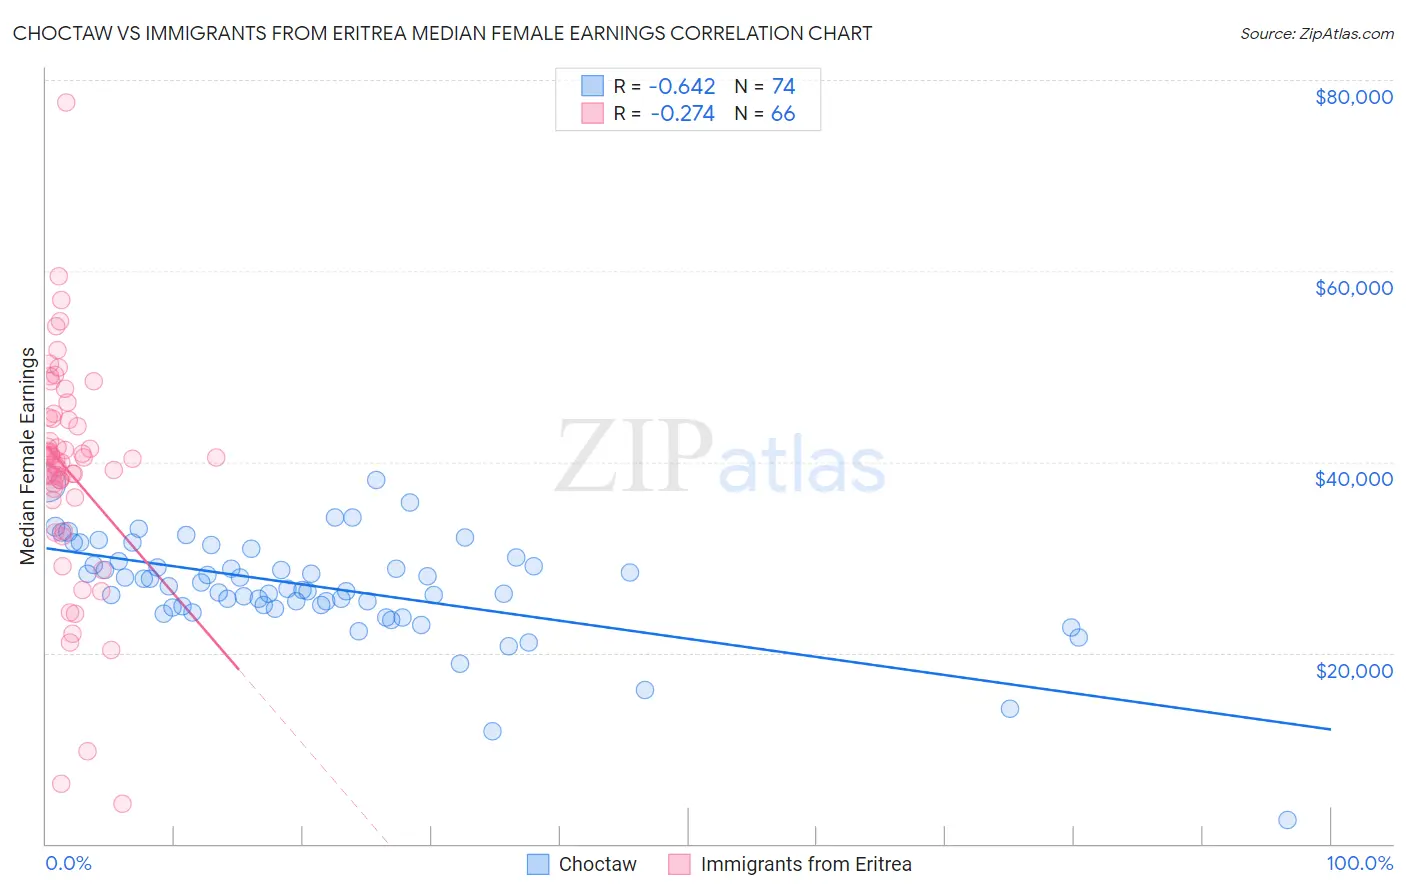
Choctaw vs Immigrants from Eritrea Median Female Earnings Correlation Chart
The statistical analysis conducted on geographies consisting of 269,561,547 people shows a significant negative correlation between the proportion of Choctaw and median female earnings in the United States with a correlation coefficient (R) of -0.642 and weighted average of $33,775. Similarly, the statistical analysis conducted on geographies consisting of 104,836,938 people shows a weak negative correlation between the proportion of Immigrants from Eritrea and median female earnings in the United States with a correlation coefficient (R) of -0.274 and weighted average of $41,485, a difference of 22.8%.
Median Female Earnings Correlation Summary
| Measurement | Choctaw | Immigrants from Eritrea |
| Minimum | $2,499 | $4,132 |
| Maximum | $38,125 | $77,694 |
| Range | $35,626 | $73,562 |
| Mean | $26,859 | $38,981 |
| Median | $26,812 | $40,245 |
| Interquartile 25% (IQ1) | $24,870 | $36,285 |
| Interquartile 75% (IQ3) | $29,604 | $44,525 |
| Interquartile Range (IQR) | $4,734 | $8,239 |
| Standard Deviation (Sample) | $5,513 | $11,801 |
| Standard Deviation (Population) | $5,475 | $11,712 |
Similar Demographics by Median Female Earnings
Demographics Similar to Choctaw by Median Female Earnings
In terms of median female earnings, the demographic groups most similar to Choctaw are Native/Alaskan ($33,806, a difference of 0.090%), Mexican ($33,664, a difference of 0.33%), Menominee ($33,894, a difference of 0.35%), Spanish American Indian ($33,625, a difference of 0.45%), and Hopi ($33,932, a difference of 0.46%).
| Demographics | Rating | Rank | Median Female Earnings |
| Dutch West Indians | 0.0 /100 | #325 | Tragic $34,106 |
| Kiowa | 0.0 /100 | #326 | Tragic $34,074 |
| Cajuns | 0.0 /100 | #327 | Tragic $34,034 |
| Immigrants | Central America | 0.0 /100 | #328 | Tragic $33,953 |
| Hopi | 0.0 /100 | #329 | Tragic $33,932 |
| Menominee | 0.0 /100 | #330 | Tragic $33,894 |
| Natives/Alaskans | 0.0 /100 | #331 | Tragic $33,806 |
| Choctaw | 0.0 /100 | #332 | Tragic $33,775 |
| Mexicans | 0.0 /100 | #333 | Tragic $33,664 |
| Spanish American Indians | 0.0 /100 | #334 | Tragic $33,625 |
| Creek | 0.0 /100 | #335 | Tragic $33,437 |
| Ottawa | 0.0 /100 | #336 | Tragic $33,378 |
| Yakama | 0.0 /100 | #337 | Tragic $33,354 |
| Immigrants | Cuba | 0.0 /100 | #338 | Tragic $33,291 |
| Immigrants | Mexico | 0.0 /100 | #339 | Tragic $33,236 |
Demographics Similar to Immigrants from Eritrea by Median Female Earnings
In terms of median female earnings, the demographic groups most similar to Immigrants from Eritrea are Palestinian ($41,484, a difference of 0.0%), Italian ($41,505, a difference of 0.050%), Jordanian ($41,464, a difference of 0.050%), Chinese ($41,461, a difference of 0.060%), and Immigrants from Zimbabwe ($41,527, a difference of 0.10%).
| Demographics | Rating | Rank | Median Female Earnings |
| Immigrants | Barbados | 98.4 /100 | #99 | Exceptional $41,685 |
| Romanians | 98.3 /100 | #100 | Exceptional $41,663 |
| Immigrants | Fiji | 98.3 /100 | #101 | Exceptional $41,656 |
| Immigrants | Poland | 98.2 /100 | #102 | Exceptional $41,630 |
| Immigrants | Argentina | 97.9 /100 | #103 | Exceptional $41,554 |
| Immigrants | Zimbabwe | 97.8 /100 | #104 | Exceptional $41,527 |
| Italians | 97.7 /100 | #105 | Exceptional $41,505 |
| Immigrants | Eritrea | 97.6 /100 | #106 | Exceptional $41,485 |
| Palestinians | 97.6 /100 | #107 | Exceptional $41,484 |
| Jordanians | 97.5 /100 | #108 | Exceptional $41,464 |
| Chinese | 97.5 /100 | #109 | Exceptional $41,461 |
| Immigrants | Western Asia | 97.0 /100 | #110 | Exceptional $41,375 |
| Immigrants | Canada | 97.0 /100 | #111 | Exceptional $41,373 |
| Immigrants | North America | 96.7 /100 | #112 | Exceptional $41,319 |
| Macedonians | 96.4 /100 | #113 | Exceptional $41,286 |