Romanian vs Immigrants from Eritrea Median Female Earnings
COMPARE
Romanian
Immigrants from Eritrea
Median Female Earnings
Median Female Earnings Comparison
Romanians
Immigrants from Eritrea
$41,663
MEDIAN FEMALE EARNINGS
98.3/ 100
METRIC RATING
100th/ 347
METRIC RANK
$41,485
MEDIAN FEMALE EARNINGS
97.6/ 100
METRIC RATING
106th/ 347
METRIC RANK
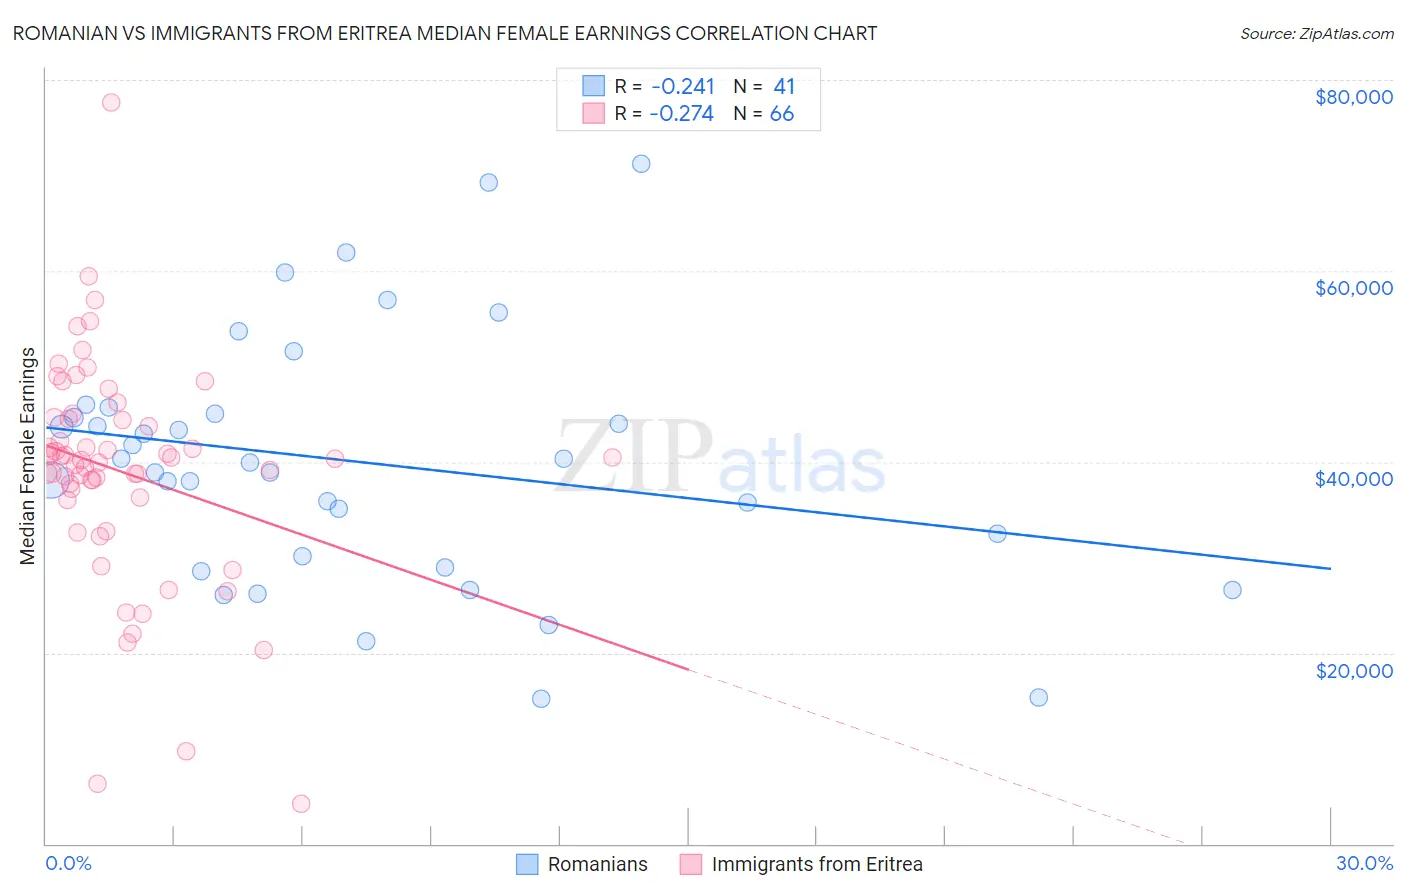
Romanian vs Immigrants from Eritrea Median Female Earnings Correlation Chart
The statistical analysis conducted on geographies consisting of 377,764,686 people shows a weak negative correlation between the proportion of Romanians and median female earnings in the United States with a correlation coefficient (R) of -0.241 and weighted average of $41,663. Similarly, the statistical analysis conducted on geographies consisting of 104,836,938 people shows a weak negative correlation between the proportion of Immigrants from Eritrea and median female earnings in the United States with a correlation coefficient (R) of -0.274 and weighted average of $41,485, a difference of 0.43%.
Median Female Earnings Correlation Summary
| Measurement | Romanian | Immigrants from Eritrea |
| Minimum | $15,248 | $4,132 |
| Maximum | $71,250 | $77,694 |
| Range | $56,002 | $73,562 |
| Mean | $39,999 | $38,981 |
| Median | $39,890 | $40,245 |
| Interquartile 25% (IQ1) | $29,536 | $36,285 |
| Interquartile 75% (IQ3) | $45,366 | $44,525 |
| Interquartile Range (IQR) | $15,830 | $8,239 |
| Standard Deviation (Sample) | $13,074 | $11,801 |
| Standard Deviation (Population) | $12,914 | $11,712 |
Demographics Similar to Romanians and Immigrants from Eritrea by Median Female Earnings
In terms of median female earnings, the demographic groups most similar to Romanians are Immigrants from Fiji ($41,656, a difference of 0.020%), Immigrants from Barbados ($41,685, a difference of 0.050%), Immigrants from Poland ($41,630, a difference of 0.080%), Immigrants from Scotland ($41,771, a difference of 0.26%), and Immigrants from Argentina ($41,554, a difference of 0.26%). Similarly, the demographic groups most similar to Immigrants from Eritrea are Palestinian ($41,484, a difference of 0.0%), Italian ($41,505, a difference of 0.050%), Jordanian ($41,464, a difference of 0.050%), Chinese ($41,461, a difference of 0.060%), and Immigrants from Zimbabwe ($41,527, a difference of 0.10%).
| Demographics | Rating | Rank | Median Female Earnings |
| Immigrants | Grenada | 99.0 /100 | #93 | Exceptional $41,932 |
| Moroccans | 98.9 /100 | #94 | Exceptional $41,872 |
| Immigrants | Netherlands | 98.9 /100 | #95 | Exceptional $41,870 |
| South Africans | 98.8 /100 | #96 | Exceptional $41,825 |
| Immigrants | Hungary | 98.8 /100 | #97 | Exceptional $41,820 |
| Immigrants | Scotland | 98.7 /100 | #98 | Exceptional $41,771 |
| Immigrants | Barbados | 98.4 /100 | #99 | Exceptional $41,685 |
| Romanians | 98.3 /100 | #100 | Exceptional $41,663 |
| Immigrants | Fiji | 98.3 /100 | #101 | Exceptional $41,656 |
| Immigrants | Poland | 98.2 /100 | #102 | Exceptional $41,630 |
| Immigrants | Argentina | 97.9 /100 | #103 | Exceptional $41,554 |
| Immigrants | Zimbabwe | 97.8 /100 | #104 | Exceptional $41,527 |
| Italians | 97.7 /100 | #105 | Exceptional $41,505 |
| Immigrants | Eritrea | 97.6 /100 | #106 | Exceptional $41,485 |
| Palestinians | 97.6 /100 | #107 | Exceptional $41,484 |
| Jordanians | 97.5 /100 | #108 | Exceptional $41,464 |
| Chinese | 97.5 /100 | #109 | Exceptional $41,461 |
| Immigrants | Western Asia | 97.0 /100 | #110 | Exceptional $41,375 |
| Immigrants | Canada | 97.0 /100 | #111 | Exceptional $41,373 |
| Immigrants | North America | 96.7 /100 | #112 | Exceptional $41,319 |
| Macedonians | 96.4 /100 | #113 | Exceptional $41,286 |