Choctaw vs Immigrants from Nigeria Median Female Earnings
COMPARE
Choctaw
Immigrants from Nigeria
Median Female Earnings
Median Female Earnings Comparison
Choctaw
Immigrants from Nigeria
$33,775
MEDIAN FEMALE EARNINGS
0.0/ 100
METRIC RATING
332nd/ 347
METRIC RANK
$39,294
MEDIAN FEMALE EARNINGS
30.2/ 100
METRIC RATING
193rd/ 347
METRIC RANK
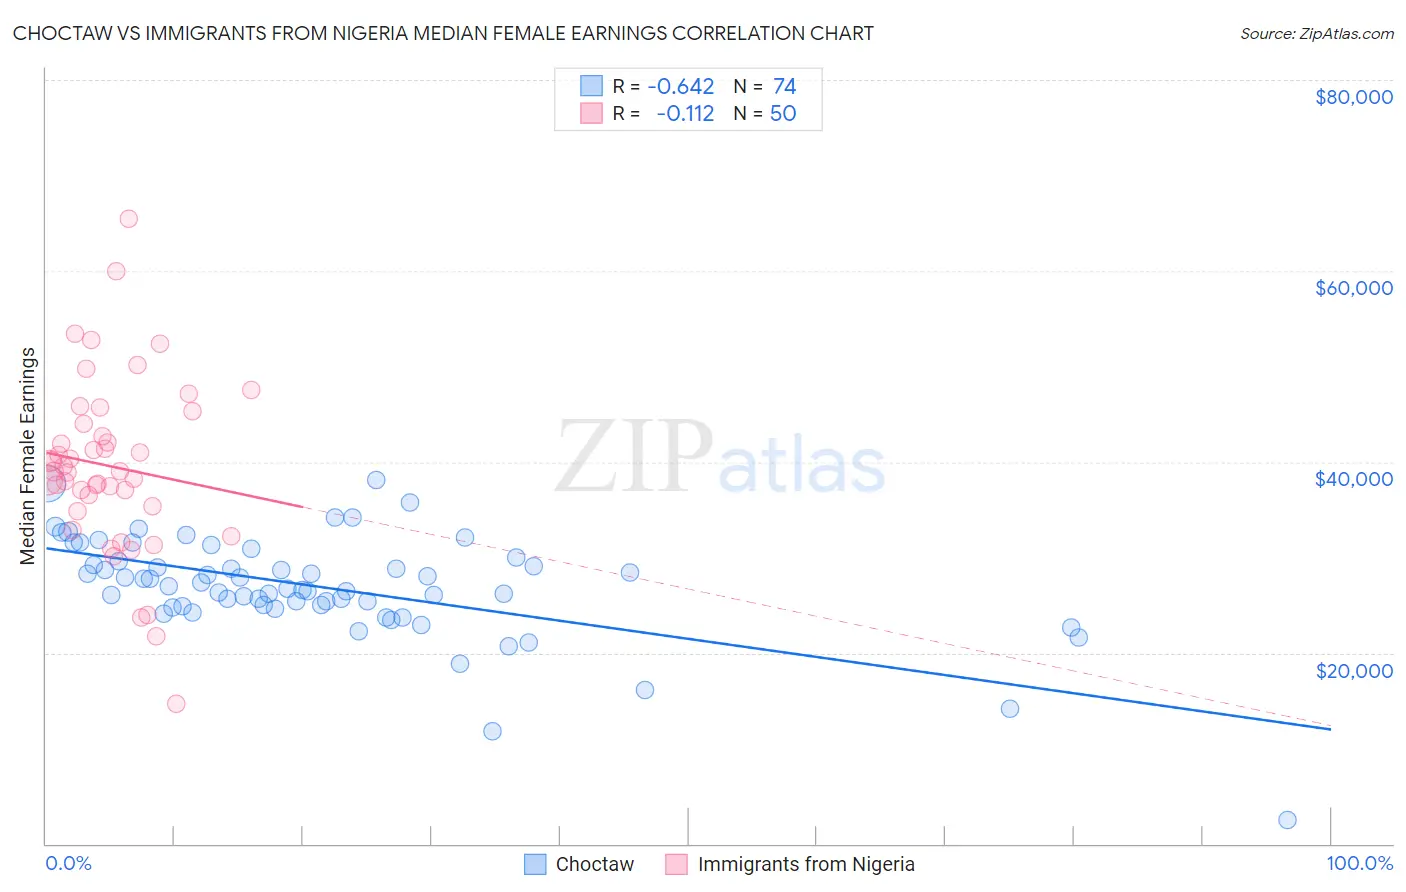
Choctaw vs Immigrants from Nigeria Median Female Earnings Correlation Chart
The statistical analysis conducted on geographies consisting of 269,561,547 people shows a significant negative correlation between the proportion of Choctaw and median female earnings in the United States with a correlation coefficient (R) of -0.642 and weighted average of $33,775. Similarly, the statistical analysis conducted on geographies consisting of 283,458,757 people shows a poor negative correlation between the proportion of Immigrants from Nigeria and median female earnings in the United States with a correlation coefficient (R) of -0.112 and weighted average of $39,294, a difference of 16.3%.
Median Female Earnings Correlation Summary
| Measurement | Choctaw | Immigrants from Nigeria |
| Minimum | $2,499 | $14,696 |
| Maximum | $38,125 | $65,528 |
| Range | $35,626 | $50,832 |
| Mean | $26,859 | $39,545 |
| Median | $26,812 | $39,021 |
| Interquartile 25% (IQ1) | $24,870 | $35,340 |
| Interquartile 75% (IQ3) | $29,604 | $44,001 |
| Interquartile Range (IQR) | $4,734 | $8,661 |
| Standard Deviation (Sample) | $5,513 | $9,154 |
| Standard Deviation (Population) | $5,475 | $9,062 |
Similar Demographics by Median Female Earnings
Demographics Similar to Choctaw by Median Female Earnings
In terms of median female earnings, the demographic groups most similar to Choctaw are Native/Alaskan ($33,806, a difference of 0.090%), Mexican ($33,664, a difference of 0.33%), Menominee ($33,894, a difference of 0.35%), Spanish American Indian ($33,625, a difference of 0.45%), and Hopi ($33,932, a difference of 0.46%).
| Demographics | Rating | Rank | Median Female Earnings |
| Dutch West Indians | 0.0 /100 | #325 | Tragic $34,106 |
| Kiowa | 0.0 /100 | #326 | Tragic $34,074 |
| Cajuns | 0.0 /100 | #327 | Tragic $34,034 |
| Immigrants | Central America | 0.0 /100 | #328 | Tragic $33,953 |
| Hopi | 0.0 /100 | #329 | Tragic $33,932 |
| Menominee | 0.0 /100 | #330 | Tragic $33,894 |
| Natives/Alaskans | 0.0 /100 | #331 | Tragic $33,806 |
| Choctaw | 0.0 /100 | #332 | Tragic $33,775 |
| Mexicans | 0.0 /100 | #333 | Tragic $33,664 |
| Spanish American Indians | 0.0 /100 | #334 | Tragic $33,625 |
| Creek | 0.0 /100 | #335 | Tragic $33,437 |
| Ottawa | 0.0 /100 | #336 | Tragic $33,378 |
| Yakama | 0.0 /100 | #337 | Tragic $33,354 |
| Immigrants | Cuba | 0.0 /100 | #338 | Tragic $33,291 |
| Immigrants | Mexico | 0.0 /100 | #339 | Tragic $33,236 |
Demographics Similar to Immigrants from Nigeria by Median Female Earnings
In terms of median female earnings, the demographic groups most similar to Immigrants from Nigeria are Irish ($39,291, a difference of 0.010%), Immigrants ($39,328, a difference of 0.090%), Immigrants from Western Africa ($39,351, a difference of 0.14%), Uruguayan ($39,228, a difference of 0.17%), and Puget Sound Salish ($39,376, a difference of 0.21%).
| Demographics | Rating | Rank | Median Female Earnings |
| Colombians | 36.9 /100 | #186 | Fair $39,439 |
| Swedes | 36.0 /100 | #187 | Fair $39,421 |
| Bermudans | 35.9 /100 | #188 | Fair $39,418 |
| Senegalese | 34.2 /100 | #189 | Fair $39,384 |
| Puget Sound Salish | 33.9 /100 | #190 | Fair $39,376 |
| Immigrants | Western Africa | 32.7 /100 | #191 | Fair $39,351 |
| Immigrants | Immigrants | 31.7 /100 | #192 | Fair $39,328 |
| Immigrants | Nigeria | 30.2 /100 | #193 | Fair $39,294 |
| Irish | 30.0 /100 | #194 | Fair $39,291 |
| Uruguayans | 27.3 /100 | #195 | Fair $39,228 |
| Immigrants | Costa Rica | 25.6 /100 | #196 | Fair $39,186 |
| Assyrians/Chaldeans/Syriacs | 24.6 /100 | #197 | Fair $39,159 |
| Ecuadorians | 23.0 /100 | #198 | Fair $39,117 |
| Icelanders | 22.7 /100 | #199 | Fair $39,109 |
| Immigrants | Panama | 20.6 /100 | #200 | Fair $39,049 |