Choctaw vs Colombian Median Female Earnings
COMPARE
Choctaw
Colombian
Median Female Earnings
Median Female Earnings Comparison
Choctaw
Colombians
$33,775
MEDIAN FEMALE EARNINGS
0.0/ 100
METRIC RATING
332nd/ 347
METRIC RANK
$39,439
MEDIAN FEMALE EARNINGS
36.9/ 100
METRIC RATING
186th/ 347
METRIC RANK
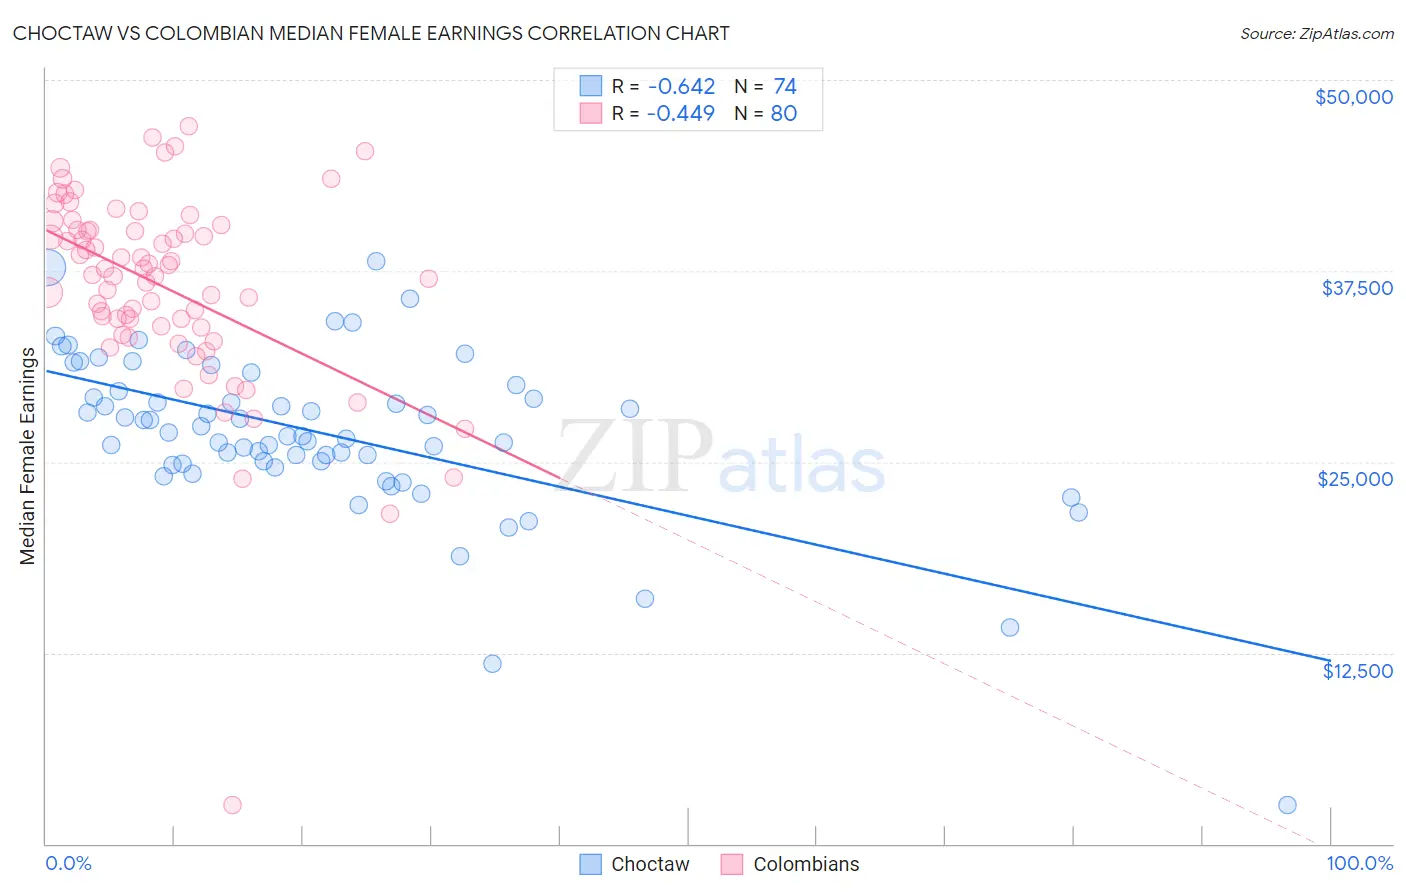
Choctaw vs Colombian Median Female Earnings Correlation Chart
The statistical analysis conducted on geographies consisting of 269,561,547 people shows a significant negative correlation between the proportion of Choctaw and median female earnings in the United States with a correlation coefficient (R) of -0.642 and weighted average of $33,775. Similarly, the statistical analysis conducted on geographies consisting of 419,536,375 people shows a moderate negative correlation between the proportion of Colombians and median female earnings in the United States with a correlation coefficient (R) of -0.449 and weighted average of $39,439, a difference of 16.8%.
Median Female Earnings Correlation Summary
| Measurement | Choctaw | Colombian |
| Minimum | $2,499 | $2,499 |
| Maximum | $38,125 | $46,974 |
| Range | $35,626 | $44,475 |
| Mean | $26,859 | $36,461 |
| Median | $26,812 | $37,418 |
| Interquartile 25% (IQ1) | $24,870 | $33,852 |
| Interquartile 75% (IQ3) | $29,604 | $40,193 |
| Interquartile Range (IQR) | $4,734 | $6,341 |
| Standard Deviation (Sample) | $5,513 | $6,518 |
| Standard Deviation (Population) | $5,475 | $6,477 |
Similar Demographics by Median Female Earnings
Demographics Similar to Choctaw by Median Female Earnings
In terms of median female earnings, the demographic groups most similar to Choctaw are Native/Alaskan ($33,806, a difference of 0.090%), Mexican ($33,664, a difference of 0.33%), Menominee ($33,894, a difference of 0.35%), Spanish American Indian ($33,625, a difference of 0.45%), and Hopi ($33,932, a difference of 0.46%).
| Demographics | Rating | Rank | Median Female Earnings |
| Dutch West Indians | 0.0 /100 | #325 | Tragic $34,106 |
| Kiowa | 0.0 /100 | #326 | Tragic $34,074 |
| Cajuns | 0.0 /100 | #327 | Tragic $34,034 |
| Immigrants | Central America | 0.0 /100 | #328 | Tragic $33,953 |
| Hopi | 0.0 /100 | #329 | Tragic $33,932 |
| Menominee | 0.0 /100 | #330 | Tragic $33,894 |
| Natives/Alaskans | 0.0 /100 | #331 | Tragic $33,806 |
| Choctaw | 0.0 /100 | #332 | Tragic $33,775 |
| Mexicans | 0.0 /100 | #333 | Tragic $33,664 |
| Spanish American Indians | 0.0 /100 | #334 | Tragic $33,625 |
| Creek | 0.0 /100 | #335 | Tragic $33,437 |
| Ottawa | 0.0 /100 | #336 | Tragic $33,378 |
| Yakama | 0.0 /100 | #337 | Tragic $33,354 |
| Immigrants | Cuba | 0.0 /100 | #338 | Tragic $33,291 |
| Immigrants | Mexico | 0.0 /100 | #339 | Tragic $33,236 |
Demographics Similar to Colombians by Median Female Earnings
In terms of median female earnings, the demographic groups most similar to Colombians are Immigrants from West Indies ($39,441, a difference of 0.0%), European ($39,457, a difference of 0.040%), Swedish ($39,421, a difference of 0.050%), Bermudan ($39,418, a difference of 0.050%), and Senegalese ($39,384, a difference of 0.14%).
| Demographics | Rating | Rank | Median Female Earnings |
| Immigrants | Germany | 45.1 /100 | #179 | Average $39,603 |
| Immigrants | Kenya | 41.6 /100 | #180 | Average $39,535 |
| Tsimshian | 41.4 /100 | #181 | Average $39,530 |
| Tlingit-Haida | 40.5 /100 | #182 | Average $39,513 |
| Hungarians | 40.3 /100 | #183 | Average $39,510 |
| Europeans | 37.7 /100 | #184 | Fair $39,457 |
| Immigrants | West Indies | 36.9 /100 | #185 | Fair $39,441 |
| Colombians | 36.9 /100 | #186 | Fair $39,439 |
| Swedes | 36.0 /100 | #187 | Fair $39,421 |
| Bermudans | 35.9 /100 | #188 | Fair $39,418 |
| Senegalese | 34.2 /100 | #189 | Fair $39,384 |
| Puget Sound Salish | 33.9 /100 | #190 | Fair $39,376 |
| Immigrants | Western Africa | 32.7 /100 | #191 | Fair $39,351 |
| Immigrants | Immigrants | 31.7 /100 | #192 | Fair $39,328 |
| Immigrants | Nigeria | 30.2 /100 | #193 | Fair $39,294 |