Liberian vs Immigrants from Eritrea Median Female Earnings
COMPARE
Liberian
Immigrants from Eritrea
Median Female Earnings
Median Female Earnings Comparison
Liberians
Immigrants from Eritrea
$38,215
MEDIAN FEMALE EARNINGS
4.4/ 100
METRIC RATING
236th/ 347
METRIC RANK
$41,485
MEDIAN FEMALE EARNINGS
97.6/ 100
METRIC RATING
106th/ 347
METRIC RANK
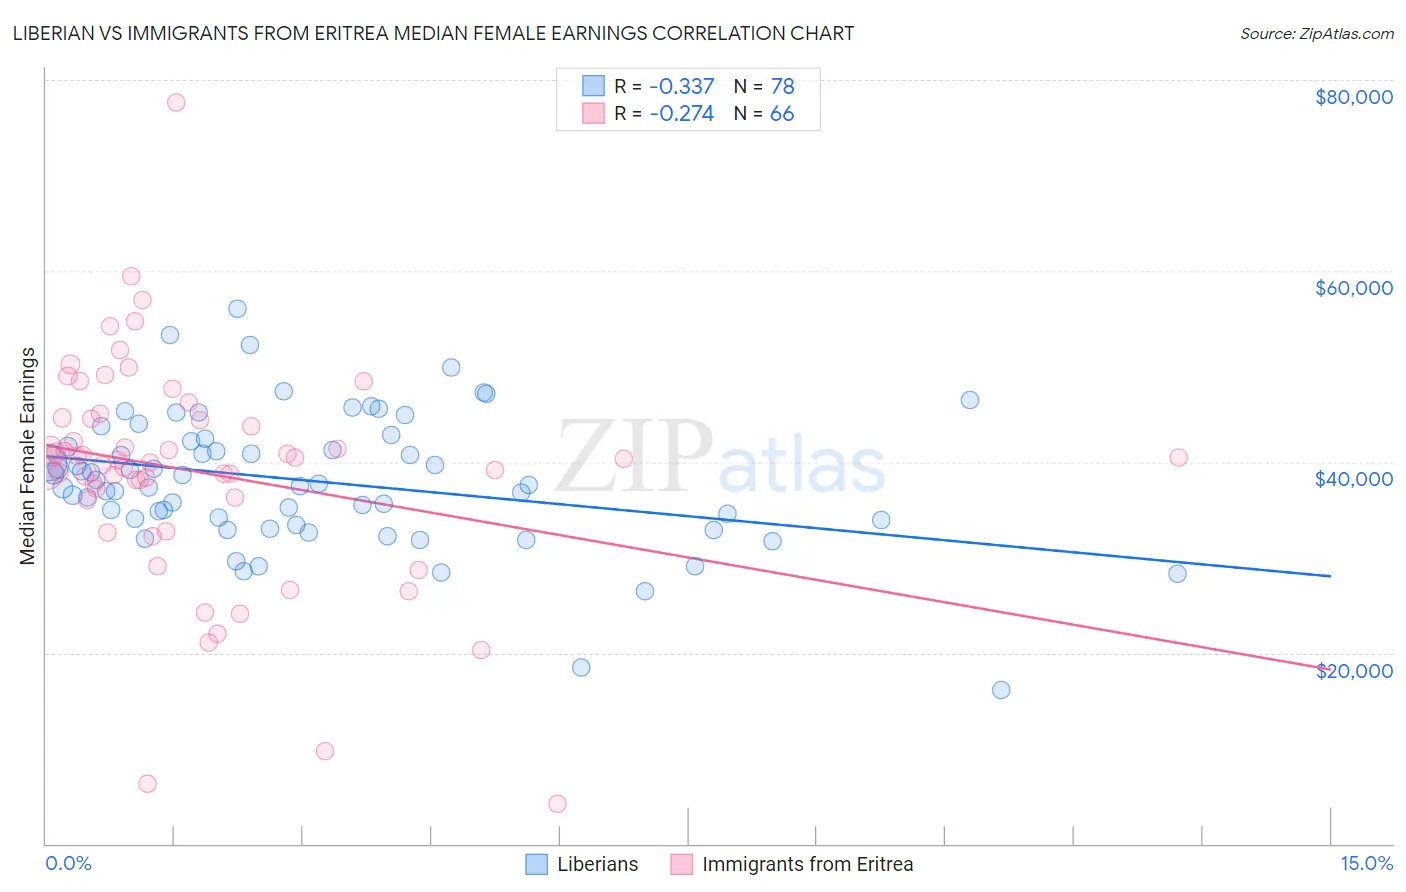
Liberian vs Immigrants from Eritrea Median Female Earnings Correlation Chart
The statistical analysis conducted on geographies consisting of 118,095,616 people shows a mild negative correlation between the proportion of Liberians and median female earnings in the United States with a correlation coefficient (R) of -0.337 and weighted average of $38,215. Similarly, the statistical analysis conducted on geographies consisting of 104,836,938 people shows a weak negative correlation between the proportion of Immigrants from Eritrea and median female earnings in the United States with a correlation coefficient (R) of -0.274 and weighted average of $41,485, a difference of 8.6%.
Median Female Earnings Correlation Summary
| Measurement | Liberian | Immigrants from Eritrea |
| Minimum | $16,076 | $4,132 |
| Maximum | $56,012 | $77,694 |
| Range | $39,936 | $73,562 |
| Mean | $37,973 | $38,981 |
| Median | $37,624 | $40,245 |
| Interquartile 25% (IQ1) | $33,939 | $36,285 |
| Interquartile 75% (IQ3) | $42,173 | $44,525 |
| Interquartile Range (IQR) | $8,234 | $8,239 |
| Standard Deviation (Sample) | $6,991 | $11,801 |
| Standard Deviation (Population) | $6,946 | $11,712 |
Similar Demographics by Median Female Earnings
Demographics Similar to Liberians by Median Female Earnings
In terms of median female earnings, the demographic groups most similar to Liberians are Sudanese ($38,215, a difference of 0.0%), Immigrants from Cabo Verde ($38,208, a difference of 0.020%), Alaska Native ($38,202, a difference of 0.030%), English ($38,196, a difference of 0.050%), and Finnish ($38,173, a difference of 0.11%).
| Demographics | Rating | Rank | Median Female Earnings |
| Belgians | 6.1 /100 | #229 | Tragic $38,382 |
| Basques | 5.7 /100 | #230 | Tragic $38,352 |
| Somalis | 5.5 /100 | #231 | Tragic $38,333 |
| Scandinavians | 5.2 /100 | #232 | Tragic $38,306 |
| Tongans | 5.1 /100 | #233 | Tragic $38,288 |
| Celtics | 5.0 /100 | #234 | Tragic $38,283 |
| Sudanese | 4.4 /100 | #235 | Tragic $38,215 |
| Liberians | 4.4 /100 | #236 | Tragic $38,215 |
| Immigrants | Cabo Verde | 4.3 /100 | #237 | Tragic $38,208 |
| Alaska Natives | 4.3 /100 | #238 | Tragic $38,202 |
| English | 4.2 /100 | #239 | Tragic $38,196 |
| Finns | 4.0 /100 | #240 | Tragic $38,173 |
| Spanish | 3.5 /100 | #241 | Tragic $38,098 |
| Immigrants | Burma/Myanmar | 3.0 /100 | #242 | Tragic $38,028 |
| Germans | 2.8 /100 | #243 | Tragic $37,986 |
Demographics Similar to Immigrants from Eritrea by Median Female Earnings
In terms of median female earnings, the demographic groups most similar to Immigrants from Eritrea are Palestinian ($41,484, a difference of 0.0%), Italian ($41,505, a difference of 0.050%), Jordanian ($41,464, a difference of 0.050%), Chinese ($41,461, a difference of 0.060%), and Immigrants from Zimbabwe ($41,527, a difference of 0.10%).
| Demographics | Rating | Rank | Median Female Earnings |
| Immigrants | Barbados | 98.4 /100 | #99 | Exceptional $41,685 |
| Romanians | 98.3 /100 | #100 | Exceptional $41,663 |
| Immigrants | Fiji | 98.3 /100 | #101 | Exceptional $41,656 |
| Immigrants | Poland | 98.2 /100 | #102 | Exceptional $41,630 |
| Immigrants | Argentina | 97.9 /100 | #103 | Exceptional $41,554 |
| Immigrants | Zimbabwe | 97.8 /100 | #104 | Exceptional $41,527 |
| Italians | 97.7 /100 | #105 | Exceptional $41,505 |
| Immigrants | Eritrea | 97.6 /100 | #106 | Exceptional $41,485 |
| Palestinians | 97.6 /100 | #107 | Exceptional $41,484 |
| Jordanians | 97.5 /100 | #108 | Exceptional $41,464 |
| Chinese | 97.5 /100 | #109 | Exceptional $41,461 |
| Immigrants | Western Asia | 97.0 /100 | #110 | Exceptional $41,375 |
| Immigrants | Canada | 97.0 /100 | #111 | Exceptional $41,373 |
| Immigrants | North America | 96.7 /100 | #112 | Exceptional $41,319 |
| Macedonians | 96.4 /100 | #113 | Exceptional $41,286 |