Choctaw vs Immigrants from Ecuador Median Female Earnings
COMPARE
Choctaw
Immigrants from Ecuador
Median Female Earnings
Median Female Earnings Comparison
Choctaw
Immigrants from Ecuador
$33,775
MEDIAN FEMALE EARNINGS
0.0/ 100
METRIC RATING
332nd/ 347
METRIC RANK
$38,644
MEDIAN FEMALE EARNINGS
10.1/ 100
METRIC RATING
216th/ 347
METRIC RANK
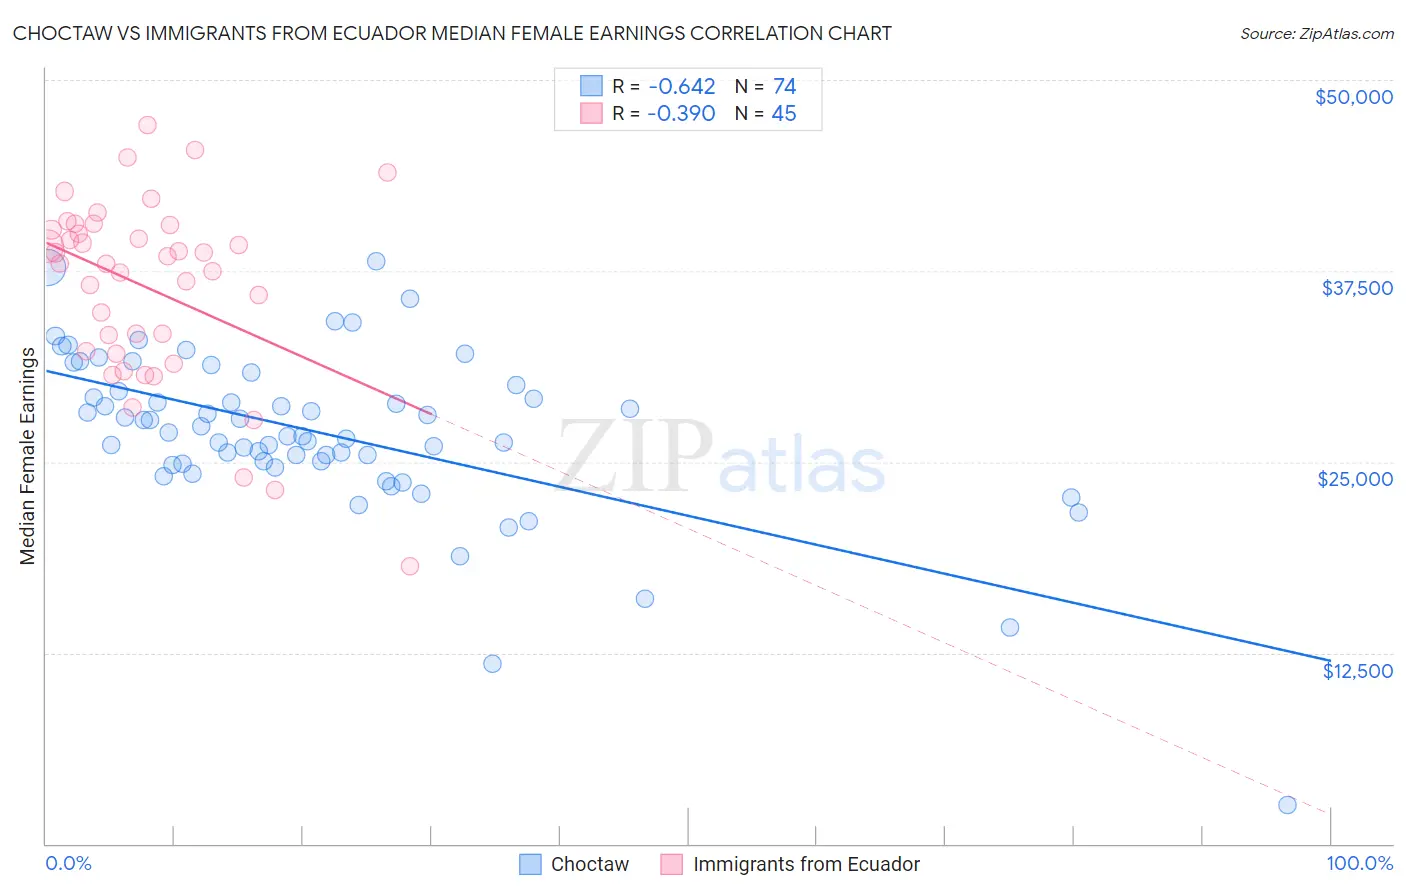
Choctaw vs Immigrants from Ecuador Median Female Earnings Correlation Chart
The statistical analysis conducted on geographies consisting of 269,561,547 people shows a significant negative correlation between the proportion of Choctaw and median female earnings in the United States with a correlation coefficient (R) of -0.642 and weighted average of $33,775. Similarly, the statistical analysis conducted on geographies consisting of 270,943,793 people shows a mild negative correlation between the proportion of Immigrants from Ecuador and median female earnings in the United States with a correlation coefficient (R) of -0.390 and weighted average of $38,644, a difference of 14.4%.
Median Female Earnings Correlation Summary
| Measurement | Choctaw | Immigrants from Ecuador |
| Minimum | $2,499 | $18,150 |
| Maximum | $38,125 | $47,087 |
| Range | $35,626 | $28,937 |
| Mean | $26,859 | $36,378 |
| Median | $26,812 | $37,998 |
| Interquartile 25% (IQ1) | $24,870 | $32,167 |
| Interquartile 75% (IQ3) | $29,604 | $40,357 |
| Interquartile Range (IQR) | $4,734 | $8,190 |
| Standard Deviation (Sample) | $5,513 | $6,055 |
| Standard Deviation (Population) | $5,475 | $5,987 |
Similar Demographics by Median Female Earnings
Demographics Similar to Choctaw by Median Female Earnings
In terms of median female earnings, the demographic groups most similar to Choctaw are Native/Alaskan ($33,806, a difference of 0.090%), Mexican ($33,664, a difference of 0.33%), Menominee ($33,894, a difference of 0.35%), Spanish American Indian ($33,625, a difference of 0.45%), and Hopi ($33,932, a difference of 0.46%).
| Demographics | Rating | Rank | Median Female Earnings |
| Dutch West Indians | 0.0 /100 | #325 | Tragic $34,106 |
| Kiowa | 0.0 /100 | #326 | Tragic $34,074 |
| Cajuns | 0.0 /100 | #327 | Tragic $34,034 |
| Immigrants | Central America | 0.0 /100 | #328 | Tragic $33,953 |
| Hopi | 0.0 /100 | #329 | Tragic $33,932 |
| Menominee | 0.0 /100 | #330 | Tragic $33,894 |
| Natives/Alaskans | 0.0 /100 | #331 | Tragic $33,806 |
| Choctaw | 0.0 /100 | #332 | Tragic $33,775 |
| Mexicans | 0.0 /100 | #333 | Tragic $33,664 |
| Spanish American Indians | 0.0 /100 | #334 | Tragic $33,625 |
| Creek | 0.0 /100 | #335 | Tragic $33,437 |
| Ottawa | 0.0 /100 | #336 | Tragic $33,378 |
| Yakama | 0.0 /100 | #337 | Tragic $33,354 |
| Immigrants | Cuba | 0.0 /100 | #338 | Tragic $33,291 |
| Immigrants | Mexico | 0.0 /100 | #339 | Tragic $33,236 |
Demographics Similar to Immigrants from Ecuador by Median Female Earnings
In terms of median female earnings, the demographic groups most similar to Immigrants from Ecuador are Spaniard ($38,656, a difference of 0.030%), Immigrants from Jamaica ($38,625, a difference of 0.050%), Iraqi ($38,666, a difference of 0.060%), Jamaican ($38,670, a difference of 0.070%), and Cape Verdean ($38,614, a difference of 0.080%).
| Demographics | Rating | Rank | Median Female Earnings |
| Norwegians | 13.4 /100 | #209 | Poor $38,802 |
| Czechoslovakians | 12.0 /100 | #210 | Poor $38,738 |
| Aleuts | 11.6 /100 | #211 | Poor $38,719 |
| Guamanians/Chamorros | 11.5 /100 | #212 | Poor $38,717 |
| Jamaicans | 10.5 /100 | #213 | Poor $38,670 |
| Iraqis | 10.5 /100 | #214 | Poor $38,666 |
| Spaniards | 10.3 /100 | #215 | Poor $38,656 |
| Immigrants | Ecuador | 10.1 /100 | #216 | Poor $38,644 |
| Immigrants | Jamaica | 9.7 /100 | #217 | Tragic $38,625 |
| Cape Verdeans | 9.5 /100 | #218 | Tragic $38,614 |
| Nepalese | 9.3 /100 | #219 | Tragic $38,603 |
| Yugoslavians | 8.8 /100 | #220 | Tragic $38,573 |
| Immigrants | Azores | 8.8 /100 | #221 | Tragic $38,573 |
| Japanese | 8.1 /100 | #222 | Tragic $38,528 |
| Immigrants | Sudan | 7.8 /100 | #223 | Tragic $38,511 |