Choctaw vs Immigrants from China Median Female Earnings
COMPARE
Choctaw
Immigrants from China
Median Female Earnings
Median Female Earnings Comparison
Choctaw
Immigrants from China
$33,775
MEDIAN FEMALE EARNINGS
0.0/ 100
METRIC RATING
332nd/ 347
METRIC RANK
$46,972
MEDIAN FEMALE EARNINGS
100.0/ 100
METRIC RATING
10th/ 347
METRIC RANK
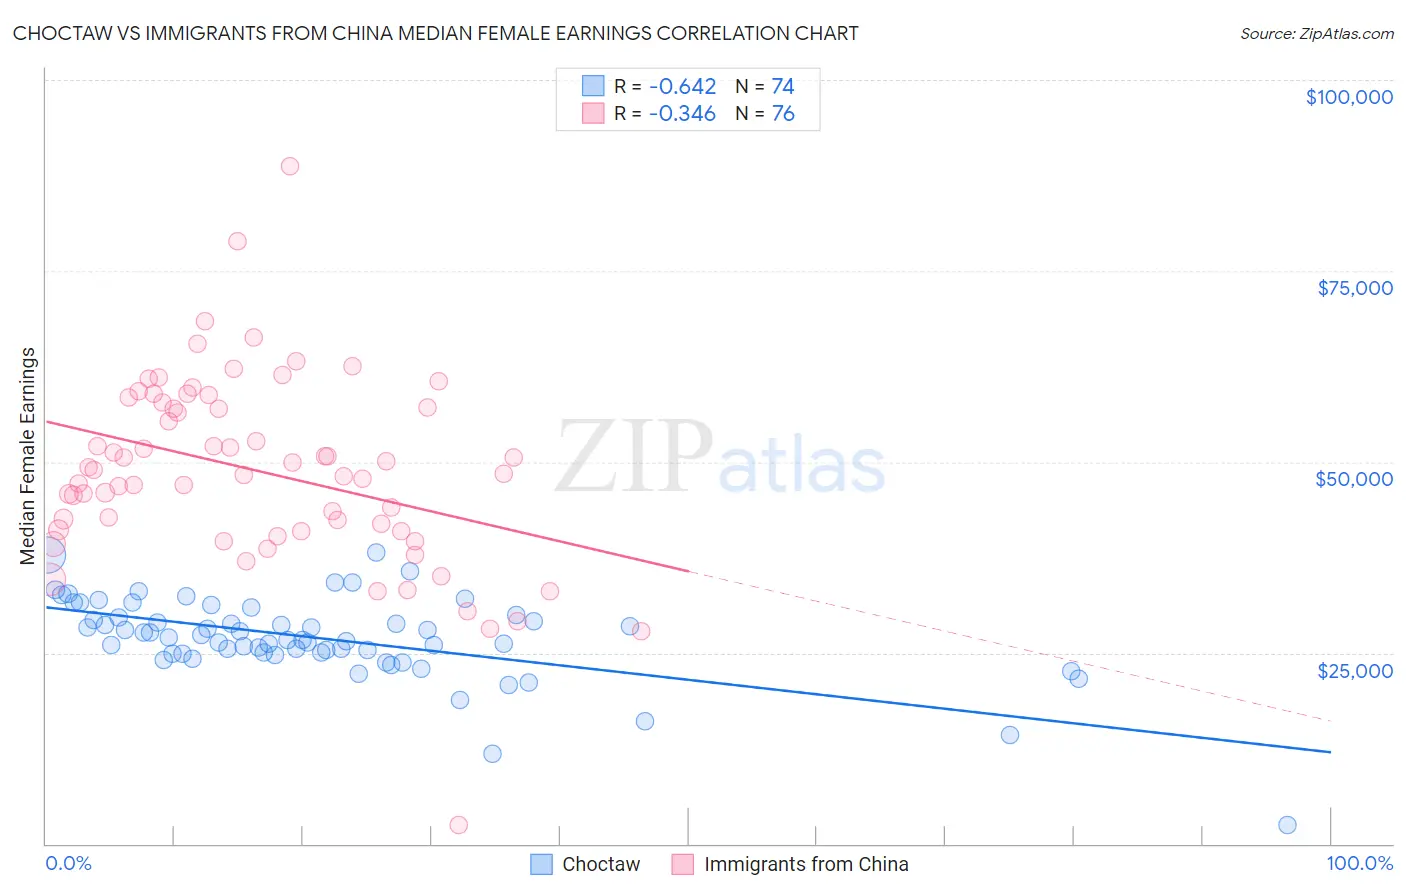
Choctaw vs Immigrants from China Median Female Earnings Correlation Chart
The statistical analysis conducted on geographies consisting of 269,561,547 people shows a significant negative correlation between the proportion of Choctaw and median female earnings in the United States with a correlation coefficient (R) of -0.642 and weighted average of $33,775. Similarly, the statistical analysis conducted on geographies consisting of 456,866,400 people shows a mild negative correlation between the proportion of Immigrants from China and median female earnings in the United States with a correlation coefficient (R) of -0.346 and weighted average of $46,972, a difference of 39.1%.
Median Female Earnings Correlation Summary
| Measurement | Choctaw | Immigrants from China |
| Minimum | $2,499 | $2,499 |
| Maximum | $38,125 | $88,690 |
| Range | $35,626 | $86,191 |
| Mean | $26,859 | $48,809 |
| Median | $26,812 | $48,719 |
| Interquartile 25% (IQ1) | $24,870 | $41,024 |
| Interquartile 75% (IQ3) | $29,604 | $57,452 |
| Interquartile Range (IQR) | $4,734 | $16,427 |
| Standard Deviation (Sample) | $5,513 | $12,504 |
| Standard Deviation (Population) | $5,475 | $12,421 |
Similar Demographics by Median Female Earnings
Demographics Similar to Choctaw by Median Female Earnings
In terms of median female earnings, the demographic groups most similar to Choctaw are Native/Alaskan ($33,806, a difference of 0.090%), Mexican ($33,664, a difference of 0.33%), Menominee ($33,894, a difference of 0.35%), Spanish American Indian ($33,625, a difference of 0.45%), and Hopi ($33,932, a difference of 0.46%).
| Demographics | Rating | Rank | Median Female Earnings |
| Dutch West Indians | 0.0 /100 | #325 | Tragic $34,106 |
| Kiowa | 0.0 /100 | #326 | Tragic $34,074 |
| Cajuns | 0.0 /100 | #327 | Tragic $34,034 |
| Immigrants | Central America | 0.0 /100 | #328 | Tragic $33,953 |
| Hopi | 0.0 /100 | #329 | Tragic $33,932 |
| Menominee | 0.0 /100 | #330 | Tragic $33,894 |
| Natives/Alaskans | 0.0 /100 | #331 | Tragic $33,806 |
| Choctaw | 0.0 /100 | #332 | Tragic $33,775 |
| Mexicans | 0.0 /100 | #333 | Tragic $33,664 |
| Spanish American Indians | 0.0 /100 | #334 | Tragic $33,625 |
| Creek | 0.0 /100 | #335 | Tragic $33,437 |
| Ottawa | 0.0 /100 | #336 | Tragic $33,378 |
| Yakama | 0.0 /100 | #337 | Tragic $33,354 |
| Immigrants | Cuba | 0.0 /100 | #338 | Tragic $33,291 |
| Immigrants | Mexico | 0.0 /100 | #339 | Tragic $33,236 |
Demographics Similar to Immigrants from China by Median Female Earnings
In terms of median female earnings, the demographic groups most similar to Immigrants from China are Okinawan ($46,905, a difference of 0.14%), Immigrants from Israel ($46,902, a difference of 0.15%), Immigrants from Iran ($47,154, a difference of 0.39%), Immigrants from Australia ($46,573, a difference of 0.86%), and Soviet Union ($46,556, a difference of 0.89%).
| Demographics | Rating | Rank | Median Female Earnings |
| Immigrants | Taiwan | 100.0 /100 | #3 | Exceptional $49,256 |
| Immigrants | India | 100.0 /100 | #4 | Exceptional $48,292 |
| Immigrants | Singapore | 100.0 /100 | #5 | Exceptional $47,986 |
| Immigrants | Ireland | 100.0 /100 | #6 | Exceptional $47,598 |
| Thais | 100.0 /100 | #7 | Exceptional $47,577 |
| Iranians | 100.0 /100 | #8 | Exceptional $47,421 |
| Immigrants | Iran | 100.0 /100 | #9 | Exceptional $47,154 |
| Immigrants | China | 100.0 /100 | #10 | Exceptional $46,972 |
| Okinawans | 100.0 /100 | #11 | Exceptional $46,905 |
| Immigrants | Israel | 100.0 /100 | #12 | Exceptional $46,902 |
| Immigrants | Australia | 100.0 /100 | #13 | Exceptional $46,573 |
| Soviet Union | 100.0 /100 | #14 | Exceptional $46,556 |
| Immigrants | Eastern Asia | 100.0 /100 | #15 | Exceptional $46,502 |
| Indians (Asian) | 100.0 /100 | #16 | Exceptional $46,481 |
| Immigrants | South Central Asia | 100.0 /100 | #17 | Exceptional $46,324 |