Choctaw vs Estonian Median Female Earnings
COMPARE
Choctaw
Estonian
Median Female Earnings
Median Female Earnings Comparison
Choctaw
Estonians
$33,775
MEDIAN FEMALE EARNINGS
0.0/ 100
METRIC RATING
332nd/ 347
METRIC RANK
$43,106
MEDIAN FEMALE EARNINGS
99.9/ 100
METRIC RATING
59th/ 347
METRIC RANK
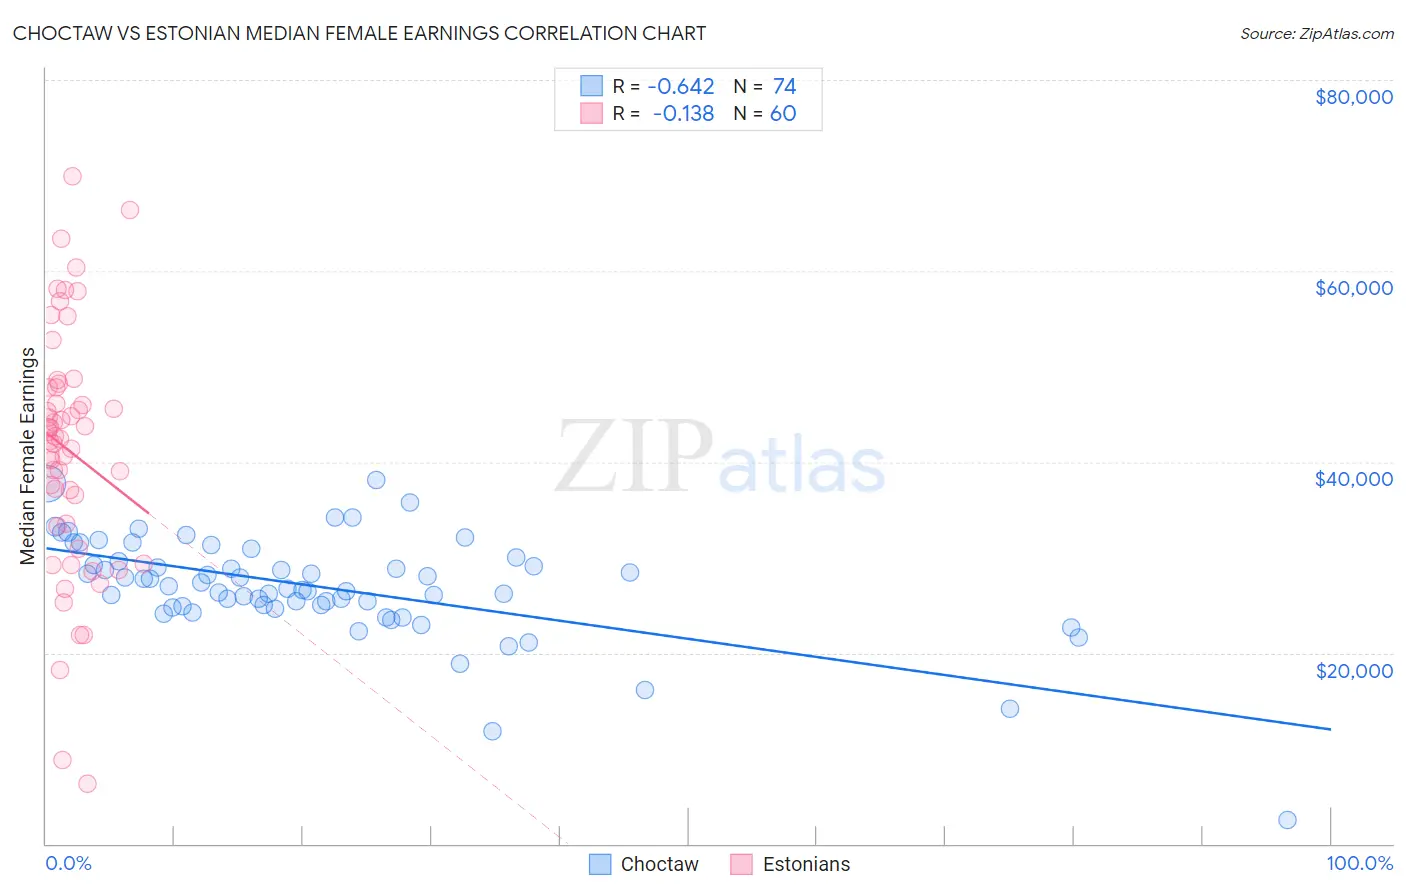
Choctaw vs Estonian Median Female Earnings Correlation Chart
The statistical analysis conducted on geographies consisting of 269,561,547 people shows a significant negative correlation between the proportion of Choctaw and median female earnings in the United States with a correlation coefficient (R) of -0.642 and weighted average of $33,775. Similarly, the statistical analysis conducted on geographies consisting of 123,507,211 people shows a poor negative correlation between the proportion of Estonians and median female earnings in the United States with a correlation coefficient (R) of -0.138 and weighted average of $43,106, a difference of 27.6%.
Median Female Earnings Correlation Summary
| Measurement | Choctaw | Estonian |
| Minimum | $2,499 | $6,250 |
| Maximum | $38,125 | $69,908 |
| Range | $35,626 | $63,658 |
| Mean | $26,859 | $41,197 |
| Median | $26,812 | $42,543 |
| Interquartile 25% (IQ1) | $24,870 | $33,356 |
| Interquartile 75% (IQ3) | $29,604 | $47,750 |
| Interquartile Range (IQR) | $4,734 | $14,393 |
| Standard Deviation (Sample) | $5,513 | $12,774 |
| Standard Deviation (Population) | $5,475 | $12,667 |
Similar Demographics by Median Female Earnings
Demographics Similar to Choctaw by Median Female Earnings
In terms of median female earnings, the demographic groups most similar to Choctaw are Native/Alaskan ($33,806, a difference of 0.090%), Mexican ($33,664, a difference of 0.33%), Menominee ($33,894, a difference of 0.35%), Spanish American Indian ($33,625, a difference of 0.45%), and Hopi ($33,932, a difference of 0.46%).
| Demographics | Rating | Rank | Median Female Earnings |
| Dutch West Indians | 0.0 /100 | #325 | Tragic $34,106 |
| Kiowa | 0.0 /100 | #326 | Tragic $34,074 |
| Cajuns | 0.0 /100 | #327 | Tragic $34,034 |
| Immigrants | Central America | 0.0 /100 | #328 | Tragic $33,953 |
| Hopi | 0.0 /100 | #329 | Tragic $33,932 |
| Menominee | 0.0 /100 | #330 | Tragic $33,894 |
| Natives/Alaskans | 0.0 /100 | #331 | Tragic $33,806 |
| Choctaw | 0.0 /100 | #332 | Tragic $33,775 |
| Mexicans | 0.0 /100 | #333 | Tragic $33,664 |
| Spanish American Indians | 0.0 /100 | #334 | Tragic $33,625 |
| Creek | 0.0 /100 | #335 | Tragic $33,437 |
| Ottawa | 0.0 /100 | #336 | Tragic $33,378 |
| Yakama | 0.0 /100 | #337 | Tragic $33,354 |
| Immigrants | Cuba | 0.0 /100 | #338 | Tragic $33,291 |
| Immigrants | Mexico | 0.0 /100 | #339 | Tragic $33,236 |
Demographics Similar to Estonians by Median Female Earnings
In terms of median female earnings, the demographic groups most similar to Estonians are Immigrants from Latvia ($43,099, a difference of 0.020%), Immigrants from Bulgaria ($43,085, a difference of 0.050%), Afghan ($43,077, a difference of 0.070%), Immigrants from Ukraine ($43,069, a difference of 0.090%), and Immigrants from Pakistan ($43,052, a difference of 0.12%).
| Demographics | Rating | Rank | Median Female Earnings |
| Immigrants | Lithuania | 99.9 /100 | #52 | Exceptional $43,317 |
| Immigrants | Eastern Europe | 99.9 /100 | #53 | Exceptional $43,309 |
| Australians | 99.9 /100 | #54 | Exceptional $43,308 |
| Egyptians | 99.9 /100 | #55 | Exceptional $43,305 |
| Immigrants | Croatia | 99.9 /100 | #56 | Exceptional $43,258 |
| Ethiopians | 99.9 /100 | #57 | Exceptional $43,243 |
| Paraguayans | 99.9 /100 | #58 | Exceptional $43,173 |
| Estonians | 99.9 /100 | #59 | Exceptional $43,106 |
| Immigrants | Latvia | 99.9 /100 | #60 | Exceptional $43,099 |
| Immigrants | Bulgaria | 99.9 /100 | #61 | Exceptional $43,085 |
| Afghans | 99.9 /100 | #62 | Exceptional $43,077 |
| Immigrants | Ukraine | 99.9 /100 | #63 | Exceptional $43,069 |
| Immigrants | Pakistan | 99.9 /100 | #64 | Exceptional $43,052 |
| Sierra Leoneans | 99.9 /100 | #65 | Exceptional $42,868 |
| Immigrants | Norway | 99.9 /100 | #66 | Exceptional $42,837 |