Choctaw vs Immigrants from Belize Median Female Earnings
COMPARE
Choctaw
Immigrants from Belize
Median Female Earnings
Median Female Earnings Comparison
Choctaw
Immigrants from Belize
$33,775
MEDIAN FEMALE EARNINGS
0.0/ 100
METRIC RATING
332nd/ 347
METRIC RANK
$37,056
MEDIAN FEMALE EARNINGS
0.4/ 100
METRIC RATING
265th/ 347
METRIC RANK
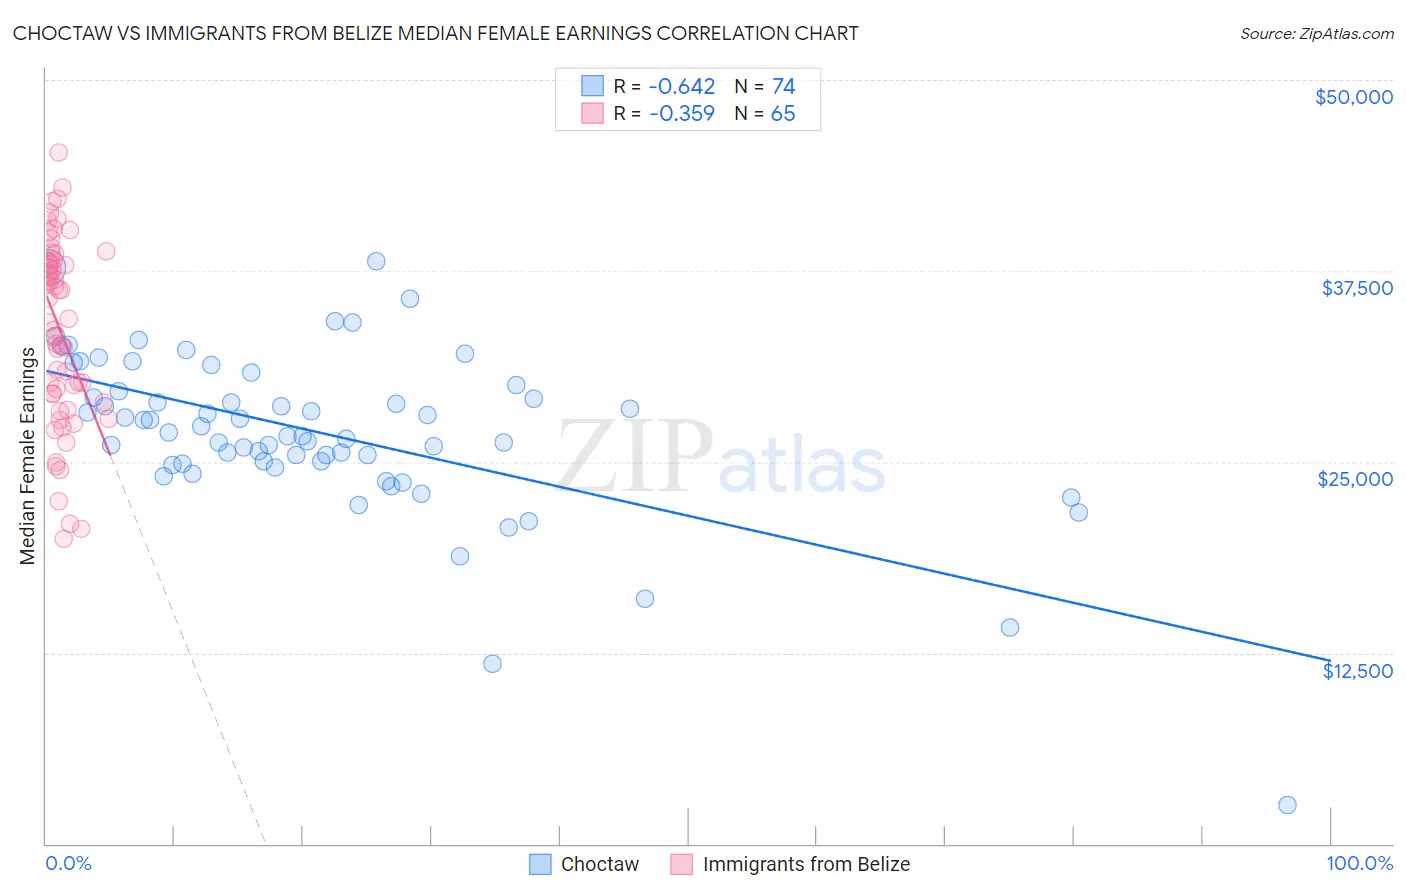
Choctaw vs Immigrants from Belize Median Female Earnings Correlation Chart
The statistical analysis conducted on geographies consisting of 269,561,547 people shows a significant negative correlation between the proportion of Choctaw and median female earnings in the United States with a correlation coefficient (R) of -0.642 and weighted average of $33,775. Similarly, the statistical analysis conducted on geographies consisting of 130,285,587 people shows a mild negative correlation between the proportion of Immigrants from Belize and median female earnings in the United States with a correlation coefficient (R) of -0.359 and weighted average of $37,056, a difference of 9.7%.
Median Female Earnings Correlation Summary
| Measurement | Choctaw | Immigrants from Belize |
| Minimum | $2,499 | $19,964 |
| Maximum | $38,125 | $45,241 |
| Range | $35,626 | $25,277 |
| Mean | $26,859 | $33,651 |
| Median | $26,812 | $34,358 |
| Interquartile 25% (IQ1) | $24,870 | $29,185 |
| Interquartile 75% (IQ3) | $29,604 | $38,173 |
| Interquartile Range (IQR) | $4,734 | $8,989 |
| Standard Deviation (Sample) | $5,513 | $6,058 |
| Standard Deviation (Population) | $5,475 | $6,012 |
Similar Demographics by Median Female Earnings
Demographics Similar to Choctaw by Median Female Earnings
In terms of median female earnings, the demographic groups most similar to Choctaw are Native/Alaskan ($33,806, a difference of 0.090%), Mexican ($33,664, a difference of 0.33%), Menominee ($33,894, a difference of 0.35%), Spanish American Indian ($33,625, a difference of 0.45%), and Hopi ($33,932, a difference of 0.46%).
| Demographics | Rating | Rank | Median Female Earnings |
| Dutch West Indians | 0.0 /100 | #325 | Tragic $34,106 |
| Kiowa | 0.0 /100 | #326 | Tragic $34,074 |
| Cajuns | 0.0 /100 | #327 | Tragic $34,034 |
| Immigrants | Central America | 0.0 /100 | #328 | Tragic $33,953 |
| Hopi | 0.0 /100 | #329 | Tragic $33,932 |
| Menominee | 0.0 /100 | #330 | Tragic $33,894 |
| Natives/Alaskans | 0.0 /100 | #331 | Tragic $33,806 |
| Choctaw | 0.0 /100 | #332 | Tragic $33,775 |
| Mexicans | 0.0 /100 | #333 | Tragic $33,664 |
| Spanish American Indians | 0.0 /100 | #334 | Tragic $33,625 |
| Creek | 0.0 /100 | #335 | Tragic $33,437 |
| Ottawa | 0.0 /100 | #336 | Tragic $33,378 |
| Yakama | 0.0 /100 | #337 | Tragic $33,354 |
| Immigrants | Cuba | 0.0 /100 | #338 | Tragic $33,291 |
| Immigrants | Mexico | 0.0 /100 | #339 | Tragic $33,236 |
Demographics Similar to Immigrants from Belize by Median Female Earnings
In terms of median female earnings, the demographic groups most similar to Immigrants from Belize are Dominican ($37,046, a difference of 0.030%), Salvadoran ($37,083, a difference of 0.070%), Nonimmigrants ($37,024, a difference of 0.090%), Cree ($37,018, a difference of 0.10%), and German Russian ($37,105, a difference of 0.13%).
| Demographics | Rating | Rank | Median Female Earnings |
| Belizeans | 0.9 /100 | #258 | Tragic $37,429 |
| Scotch-Irish | 0.8 /100 | #259 | Tragic $37,383 |
| Dutch | 0.7 /100 | #260 | Tragic $37,339 |
| Malaysians | 0.7 /100 | #261 | Tragic $37,298 |
| Venezuelans | 0.7 /100 | #262 | Tragic $37,282 |
| German Russians | 0.5 /100 | #263 | Tragic $37,105 |
| Salvadorans | 0.4 /100 | #264 | Tragic $37,083 |
| Immigrants | Belize | 0.4 /100 | #265 | Tragic $37,056 |
| Dominicans | 0.4 /100 | #266 | Tragic $37,046 |
| Immigrants | Nonimmigrants | 0.4 /100 | #267 | Tragic $37,024 |
| Cree | 0.4 /100 | #268 | Tragic $37,018 |
| Immigrants | Venezuela | 0.4 /100 | #269 | Tragic $37,003 |
| French American Indians | 0.3 /100 | #270 | Tragic $36,920 |
| Nicaraguans | 0.3 /100 | #271 | Tragic $36,904 |
| Immigrants | Dominican Republic | 0.3 /100 | #272 | Tragic $36,857 |