Assyrian/Chaldean/Syriac vs Immigrants from Eritrea Median Female Earnings
COMPARE
Assyrian/Chaldean/Syriac
Immigrants from Eritrea
Median Female Earnings
Median Female Earnings Comparison
Assyrians/Chaldeans/Syriacs
Immigrants from Eritrea
$39,159
MEDIAN FEMALE EARNINGS
24.6/ 100
METRIC RATING
197th/ 347
METRIC RANK
$41,485
MEDIAN FEMALE EARNINGS
97.6/ 100
METRIC RATING
106th/ 347
METRIC RANK
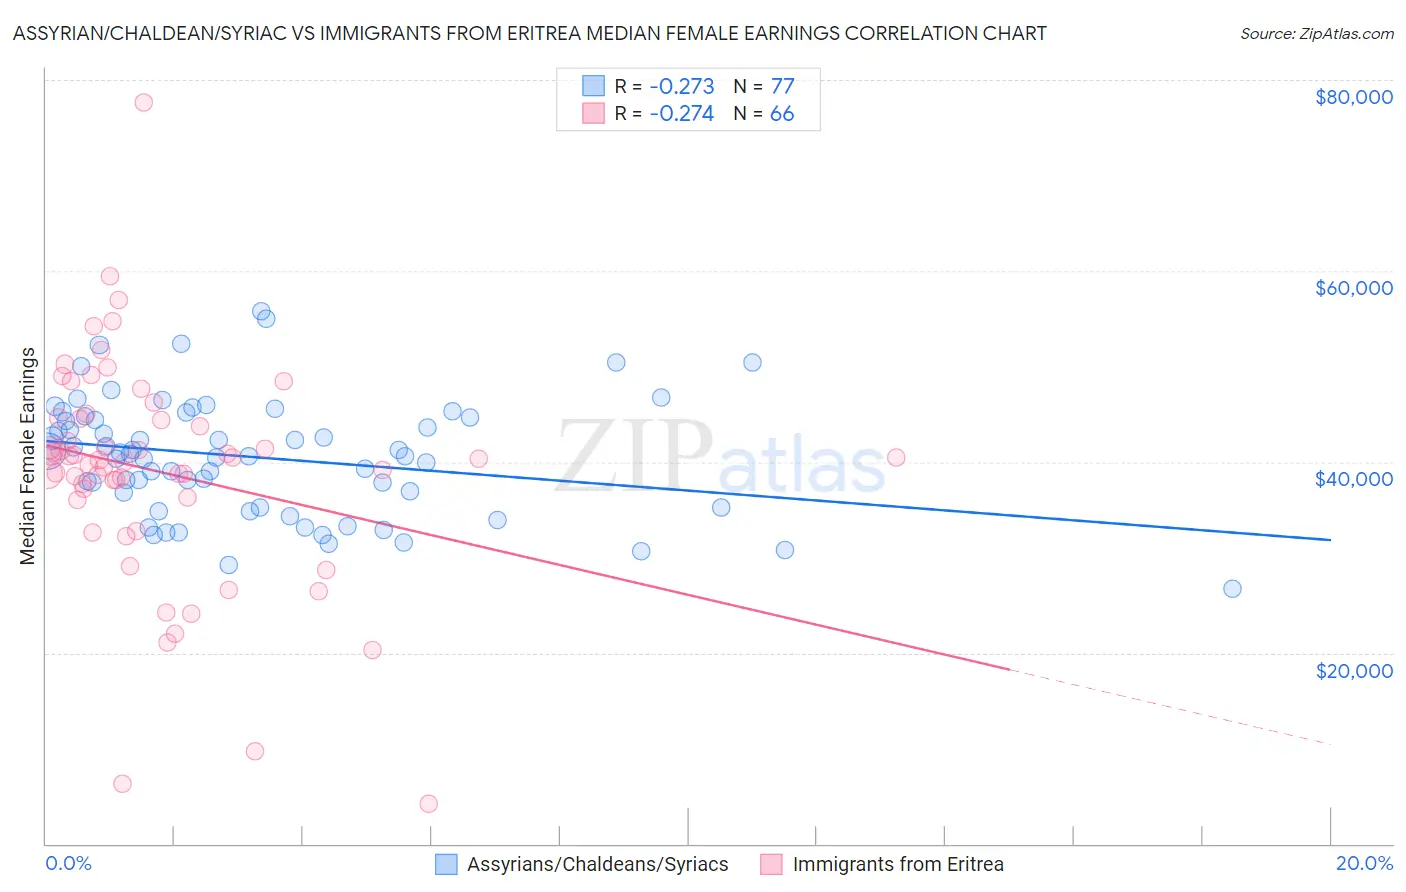
Assyrian/Chaldean/Syriac vs Immigrants from Eritrea Median Female Earnings Correlation Chart
The statistical analysis conducted on geographies consisting of 110,265,934 people shows a weak negative correlation between the proportion of Assyrians/Chaldeans/Syriacs and median female earnings in the United States with a correlation coefficient (R) of -0.273 and weighted average of $39,159. Similarly, the statistical analysis conducted on geographies consisting of 104,836,938 people shows a weak negative correlation between the proportion of Immigrants from Eritrea and median female earnings in the United States with a correlation coefficient (R) of -0.274 and weighted average of $41,485, a difference of 5.9%.
Median Female Earnings Correlation Summary
| Measurement | Assyrian/Chaldean/Syriac | Immigrants from Eritrea |
| Minimum | $26,764 | $4,132 |
| Maximum | $55,774 | $77,694 |
| Range | $29,010 | $73,562 |
| Mean | $40,436 | $38,981 |
| Median | $40,603 | $40,245 |
| Interquartile 25% (IQ1) | $35,184 | $36,285 |
| Interquartile 75% (IQ3) | $44,710 | $44,525 |
| Interquartile Range (IQR) | $9,527 | $8,239 |
| Standard Deviation (Sample) | $6,169 | $11,801 |
| Standard Deviation (Population) | $6,129 | $11,712 |
Similar Demographics by Median Female Earnings
Demographics Similar to Assyrians/Chaldeans/Syriacs by Median Female Earnings
In terms of median female earnings, the demographic groups most similar to Assyrians/Chaldeans/Syriacs are Immigrants from Costa Rica ($39,186, a difference of 0.070%), Ecuadorian ($39,117, a difference of 0.11%), Icelander ($39,109, a difference of 0.13%), Uruguayan ($39,228, a difference of 0.17%), and Immigrants from Panama ($39,049, a difference of 0.28%).
| Demographics | Rating | Rank | Median Female Earnings |
| Puget Sound Salish | 33.9 /100 | #190 | Fair $39,376 |
| Immigrants | Western Africa | 32.7 /100 | #191 | Fair $39,351 |
| Immigrants | Immigrants | 31.7 /100 | #192 | Fair $39,328 |
| Immigrants | Nigeria | 30.2 /100 | #193 | Fair $39,294 |
| Irish | 30.0 /100 | #194 | Fair $39,291 |
| Uruguayans | 27.3 /100 | #195 | Fair $39,228 |
| Immigrants | Costa Rica | 25.6 /100 | #196 | Fair $39,186 |
| Assyrians/Chaldeans/Syriacs | 24.6 /100 | #197 | Fair $39,159 |
| Ecuadorians | 23.0 /100 | #198 | Fair $39,117 |
| Icelanders | 22.7 /100 | #199 | Fair $39,109 |
| Immigrants | Panama | 20.6 /100 | #200 | Fair $39,049 |
| Panamanians | 20.6 /100 | #201 | Fair $39,049 |
| Slovaks | 19.9 /100 | #202 | Poor $39,029 |
| Czechs | 18.7 /100 | #203 | Poor $38,992 |
| Immigrants | Uruguay | 17.3 /100 | #204 | Poor $38,945 |
Demographics Similar to Immigrants from Eritrea by Median Female Earnings
In terms of median female earnings, the demographic groups most similar to Immigrants from Eritrea are Palestinian ($41,484, a difference of 0.0%), Italian ($41,505, a difference of 0.050%), Jordanian ($41,464, a difference of 0.050%), Chinese ($41,461, a difference of 0.060%), and Immigrants from Zimbabwe ($41,527, a difference of 0.10%).
| Demographics | Rating | Rank | Median Female Earnings |
| Immigrants | Barbados | 98.4 /100 | #99 | Exceptional $41,685 |
| Romanians | 98.3 /100 | #100 | Exceptional $41,663 |
| Immigrants | Fiji | 98.3 /100 | #101 | Exceptional $41,656 |
| Immigrants | Poland | 98.2 /100 | #102 | Exceptional $41,630 |
| Immigrants | Argentina | 97.9 /100 | #103 | Exceptional $41,554 |
| Immigrants | Zimbabwe | 97.8 /100 | #104 | Exceptional $41,527 |
| Italians | 97.7 /100 | #105 | Exceptional $41,505 |
| Immigrants | Eritrea | 97.6 /100 | #106 | Exceptional $41,485 |
| Palestinians | 97.6 /100 | #107 | Exceptional $41,484 |
| Jordanians | 97.5 /100 | #108 | Exceptional $41,464 |
| Chinese | 97.5 /100 | #109 | Exceptional $41,461 |
| Immigrants | Western Asia | 97.0 /100 | #110 | Exceptional $41,375 |
| Immigrants | Canada | 97.0 /100 | #111 | Exceptional $41,373 |
| Immigrants | North America | 96.7 /100 | #112 | Exceptional $41,319 |
| Macedonians | 96.4 /100 | #113 | Exceptional $41,286 |