Alsatian vs Immigrants from Eritrea Median Female Earnings
COMPARE
Alsatian
Immigrants from Eritrea
Median Female Earnings
Median Female Earnings Comparison
Alsatians
Immigrants from Eritrea
$40,060
MEDIAN FEMALE EARNINGS
68.0/ 100
METRIC RATING
161st/ 347
METRIC RANK
$41,485
MEDIAN FEMALE EARNINGS
97.6/ 100
METRIC RATING
106th/ 347
METRIC RANK
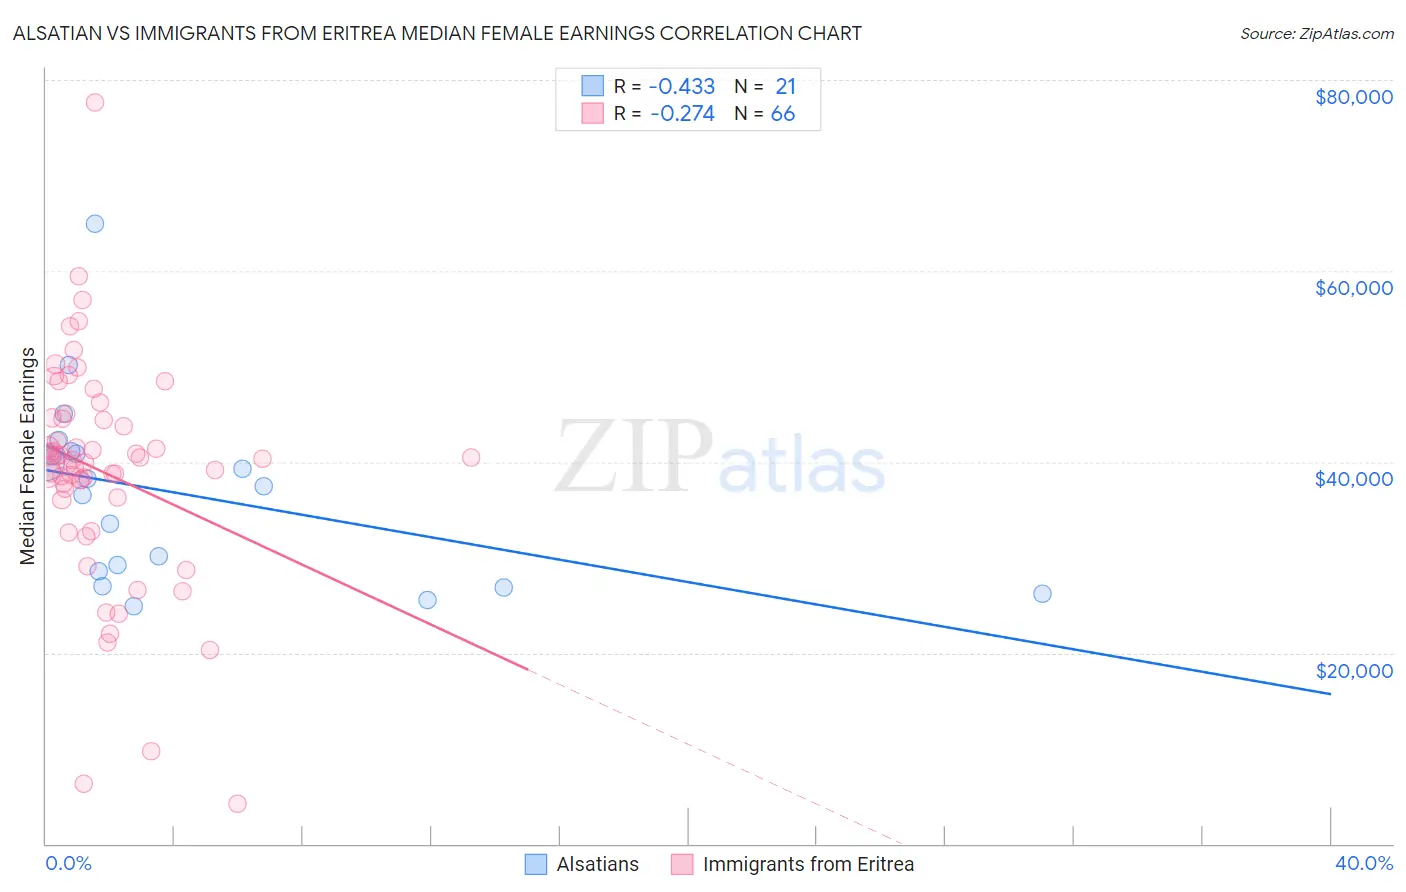
Alsatian vs Immigrants from Eritrea Median Female Earnings Correlation Chart
The statistical analysis conducted on geographies consisting of 82,671,266 people shows a moderate negative correlation between the proportion of Alsatians and median female earnings in the United States with a correlation coefficient (R) of -0.433 and weighted average of $40,060. Similarly, the statistical analysis conducted on geographies consisting of 104,836,938 people shows a weak negative correlation between the proportion of Immigrants from Eritrea and median female earnings in the United States with a correlation coefficient (R) of -0.274 and weighted average of $41,485, a difference of 3.6%.
Median Female Earnings Correlation Summary
| Measurement | Alsatian | Immigrants from Eritrea |
| Minimum | $24,833 | $4,132 |
| Maximum | $65,000 | $77,694 |
| Range | $40,167 | $73,562 |
| Mean | $36,577 | $38,981 |
| Median | $37,425 | $40,245 |
| Interquartile 25% (IQ1) | $27,720 | $36,285 |
| Interquartile 75% (IQ3) | $40,989 | $44,525 |
| Interquartile Range (IQR) | $13,268 | $8,239 |
| Standard Deviation (Sample) | $9,753 | $11,801 |
| Standard Deviation (Population) | $9,518 | $11,712 |
Similar Demographics by Median Female Earnings
Demographics Similar to Alsatians by Median Female Earnings
In terms of median female earnings, the demographic groups most similar to Alsatians are Inupiat ($40,080, a difference of 0.050%), South American Indian ($40,019, a difference of 0.10%), Lebanese ($40,006, a difference of 0.14%), Immigrants from Vietnam ($40,153, a difference of 0.23%), and Immigrants from Senegal ($40,157, a difference of 0.24%).
| Demographics | Rating | Rank | Median Female Earnings |
| Immigrants | Oceania | 77.6 /100 | #154 | Good $40,297 |
| Immigrants | Africa | 76.2 /100 | #155 | Good $40,257 |
| Peruvians | 75.3 /100 | #156 | Good $40,234 |
| Portuguese | 73.0 /100 | #157 | Good $40,177 |
| Immigrants | Senegal | 72.2 /100 | #158 | Good $40,157 |
| Immigrants | Vietnam | 72.0 /100 | #159 | Good $40,153 |
| Inupiat | 68.9 /100 | #160 | Good $40,080 |
| Alsatians | 68.0 /100 | #161 | Good $40,060 |
| South American Indians | 66.1 /100 | #162 | Good $40,019 |
| Lebanese | 65.5 /100 | #163 | Good $40,006 |
| Immigrants | Saudi Arabia | 62.9 /100 | #164 | Good $39,952 |
| Immigrants | Bangladesh | 60.8 /100 | #165 | Good $39,910 |
| Immigrants | Ghana | 60.0 /100 | #166 | Good $39,894 |
| Luxembourgers | 59.9 /100 | #167 | Average $39,891 |
| Immigrants | Peru | 58.9 /100 | #168 | Average $39,871 |
Demographics Similar to Immigrants from Eritrea by Median Female Earnings
In terms of median female earnings, the demographic groups most similar to Immigrants from Eritrea are Palestinian ($41,484, a difference of 0.0%), Italian ($41,505, a difference of 0.050%), Jordanian ($41,464, a difference of 0.050%), Chinese ($41,461, a difference of 0.060%), and Immigrants from Zimbabwe ($41,527, a difference of 0.10%).
| Demographics | Rating | Rank | Median Female Earnings |
| Immigrants | Barbados | 98.4 /100 | #99 | Exceptional $41,685 |
| Romanians | 98.3 /100 | #100 | Exceptional $41,663 |
| Immigrants | Fiji | 98.3 /100 | #101 | Exceptional $41,656 |
| Immigrants | Poland | 98.2 /100 | #102 | Exceptional $41,630 |
| Immigrants | Argentina | 97.9 /100 | #103 | Exceptional $41,554 |
| Immigrants | Zimbabwe | 97.8 /100 | #104 | Exceptional $41,527 |
| Italians | 97.7 /100 | #105 | Exceptional $41,505 |
| Immigrants | Eritrea | 97.6 /100 | #106 | Exceptional $41,485 |
| Palestinians | 97.6 /100 | #107 | Exceptional $41,484 |
| Jordanians | 97.5 /100 | #108 | Exceptional $41,464 |
| Chinese | 97.5 /100 | #109 | Exceptional $41,461 |
| Immigrants | Western Asia | 97.0 /100 | #110 | Exceptional $41,375 |
| Immigrants | Canada | 97.0 /100 | #111 | Exceptional $41,373 |
| Immigrants | North America | 96.7 /100 | #112 | Exceptional $41,319 |
| Macedonians | 96.4 /100 | #113 | Exceptional $41,286 |