Choctaw vs Immigrants from Nicaragua Median Female Earnings
COMPARE
Choctaw
Immigrants from Nicaragua
Median Female Earnings
Median Female Earnings Comparison
Choctaw
Immigrants from Nicaragua
$33,775
MEDIAN FEMALE EARNINGS
0.0/ 100
METRIC RATING
332nd/ 347
METRIC RANK
$36,023
MEDIAN FEMALE EARNINGS
0.0/ 100
METRIC RATING
287th/ 347
METRIC RANK
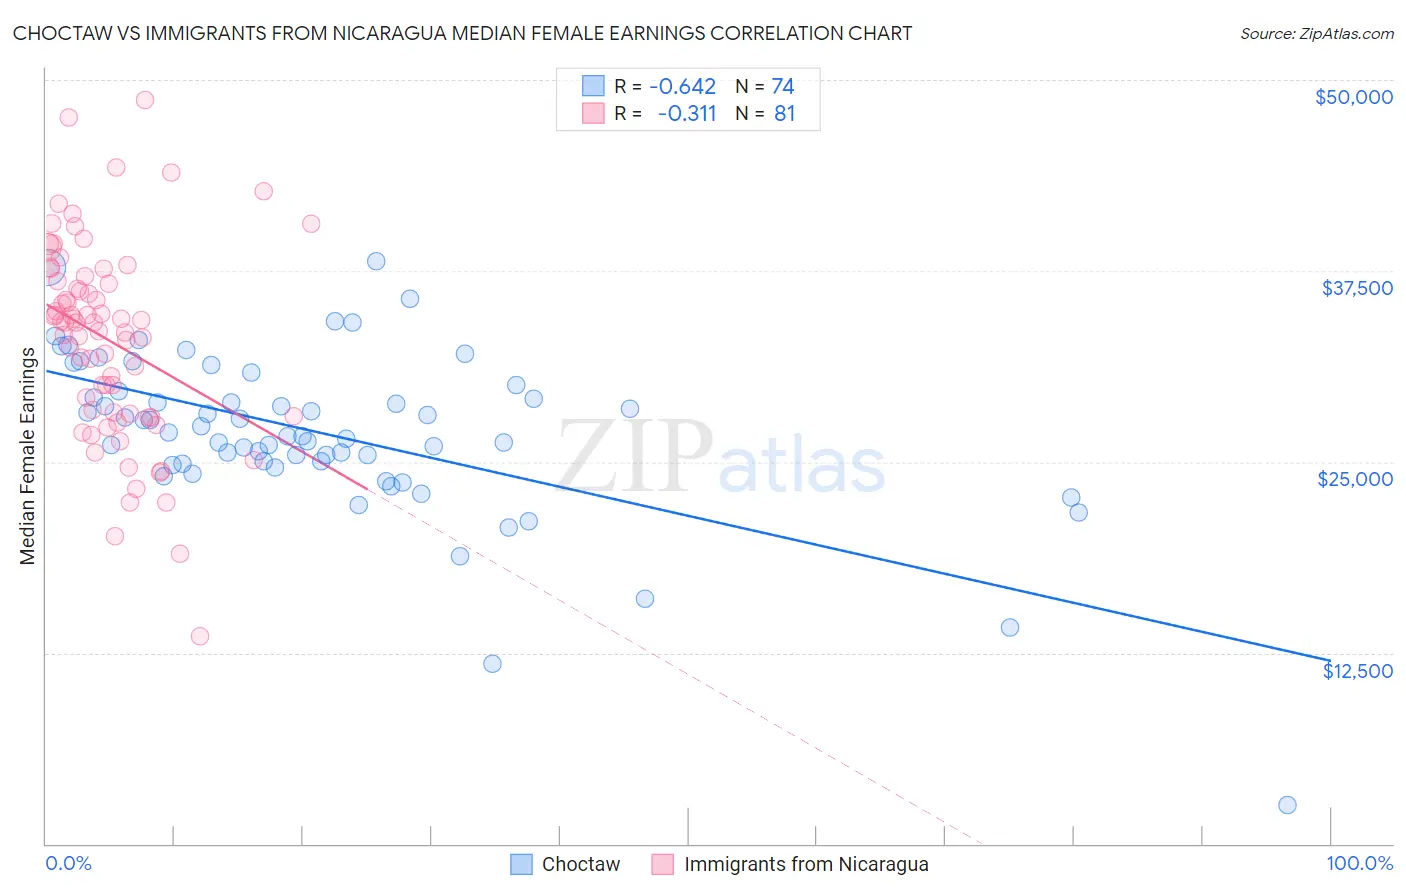
Choctaw vs Immigrants from Nicaragua Median Female Earnings Correlation Chart
The statistical analysis conducted on geographies consisting of 269,561,547 people shows a significant negative correlation between the proportion of Choctaw and median female earnings in the United States with a correlation coefficient (R) of -0.642 and weighted average of $33,775. Similarly, the statistical analysis conducted on geographies consisting of 236,298,559 people shows a mild negative correlation between the proportion of Immigrants from Nicaragua and median female earnings in the United States with a correlation coefficient (R) of -0.311 and weighted average of $36,023, a difference of 6.7%.
Median Female Earnings Correlation Summary
| Measurement | Choctaw | Immigrants from Nicaragua |
| Minimum | $2,499 | $13,608 |
| Maximum | $38,125 | $48,676 |
| Range | $35,626 | $35,068 |
| Mean | $26,859 | $32,980 |
| Median | $26,812 | $34,129 |
| Interquartile 25% (IQ1) | $24,870 | $28,072 |
| Interquartile 75% (IQ3) | $29,604 | $36,975 |
| Interquartile Range (IQR) | $4,734 | $8,904 |
| Standard Deviation (Sample) | $5,513 | $6,452 |
| Standard Deviation (Population) | $5,475 | $6,412 |
Similar Demographics by Median Female Earnings
Demographics Similar to Choctaw by Median Female Earnings
In terms of median female earnings, the demographic groups most similar to Choctaw are Native/Alaskan ($33,806, a difference of 0.090%), Mexican ($33,664, a difference of 0.33%), Menominee ($33,894, a difference of 0.35%), Spanish American Indian ($33,625, a difference of 0.45%), and Hopi ($33,932, a difference of 0.46%).
| Demographics | Rating | Rank | Median Female Earnings |
| Dutch West Indians | 0.0 /100 | #325 | Tragic $34,106 |
| Kiowa | 0.0 /100 | #326 | Tragic $34,074 |
| Cajuns | 0.0 /100 | #327 | Tragic $34,034 |
| Immigrants | Central America | 0.0 /100 | #328 | Tragic $33,953 |
| Hopi | 0.0 /100 | #329 | Tragic $33,932 |
| Menominee | 0.0 /100 | #330 | Tragic $33,894 |
| Natives/Alaskans | 0.0 /100 | #331 | Tragic $33,806 |
| Choctaw | 0.0 /100 | #332 | Tragic $33,775 |
| Mexicans | 0.0 /100 | #333 | Tragic $33,664 |
| Spanish American Indians | 0.0 /100 | #334 | Tragic $33,625 |
| Creek | 0.0 /100 | #335 | Tragic $33,437 |
| Ottawa | 0.0 /100 | #336 | Tragic $33,378 |
| Yakama | 0.0 /100 | #337 | Tragic $33,354 |
| Immigrants | Cuba | 0.0 /100 | #338 | Tragic $33,291 |
| Immigrants | Mexico | 0.0 /100 | #339 | Tragic $33,236 |
Demographics Similar to Immigrants from Nicaragua by Median Female Earnings
In terms of median female earnings, the demographic groups most similar to Immigrants from Nicaragua are Immigrants from Zaire ($36,017, a difference of 0.020%), Osage ($36,034, a difference of 0.030%), Paiute ($36,056, a difference of 0.090%), Bangladeshi ($35,960, a difference of 0.17%), and Central American Indian ($35,930, a difference of 0.26%).
| Demographics | Rating | Rank | Median Female Earnings |
| Iroquois | 0.1 /100 | #280 | Tragic $36,408 |
| Spanish Americans | 0.1 /100 | #281 | Tragic $36,391 |
| Haitians | 0.1 /100 | #282 | Tragic $36,374 |
| Immigrants | Haiti | 0.1 /100 | #283 | Tragic $36,203 |
| Indonesians | 0.1 /100 | #284 | Tragic $36,140 |
| Paiute | 0.1 /100 | #285 | Tragic $36,056 |
| Osage | 0.0 /100 | #286 | Tragic $36,034 |
| Immigrants | Nicaragua | 0.0 /100 | #287 | Tragic $36,023 |
| Immigrants | Zaire | 0.0 /100 | #288 | Tragic $36,017 |
| Bangladeshis | 0.0 /100 | #289 | Tragic $35,960 |
| Central American Indians | 0.0 /100 | #290 | Tragic $35,930 |
| Blackfeet | 0.0 /100 | #291 | Tragic $35,864 |
| Americans | 0.0 /100 | #292 | Tragic $35,777 |
| Guatemalans | 0.0 /100 | #293 | Tragic $35,695 |
| Cheyenne | 0.0 /100 | #294 | Tragic $35,673 |