Choctaw vs Immigrants from Czechoslovakia Median Female Earnings
COMPARE
Choctaw
Immigrants from Czechoslovakia
Median Female Earnings
Median Female Earnings Comparison
Choctaw
Immigrants from Czechoslovakia
$33,775
MEDIAN FEMALE EARNINGS
0.0/ 100
METRIC RATING
332nd/ 347
METRIC RANK
$43,571
MEDIAN FEMALE EARNINGS
100.0/ 100
METRIC RATING
44th/ 347
METRIC RANK
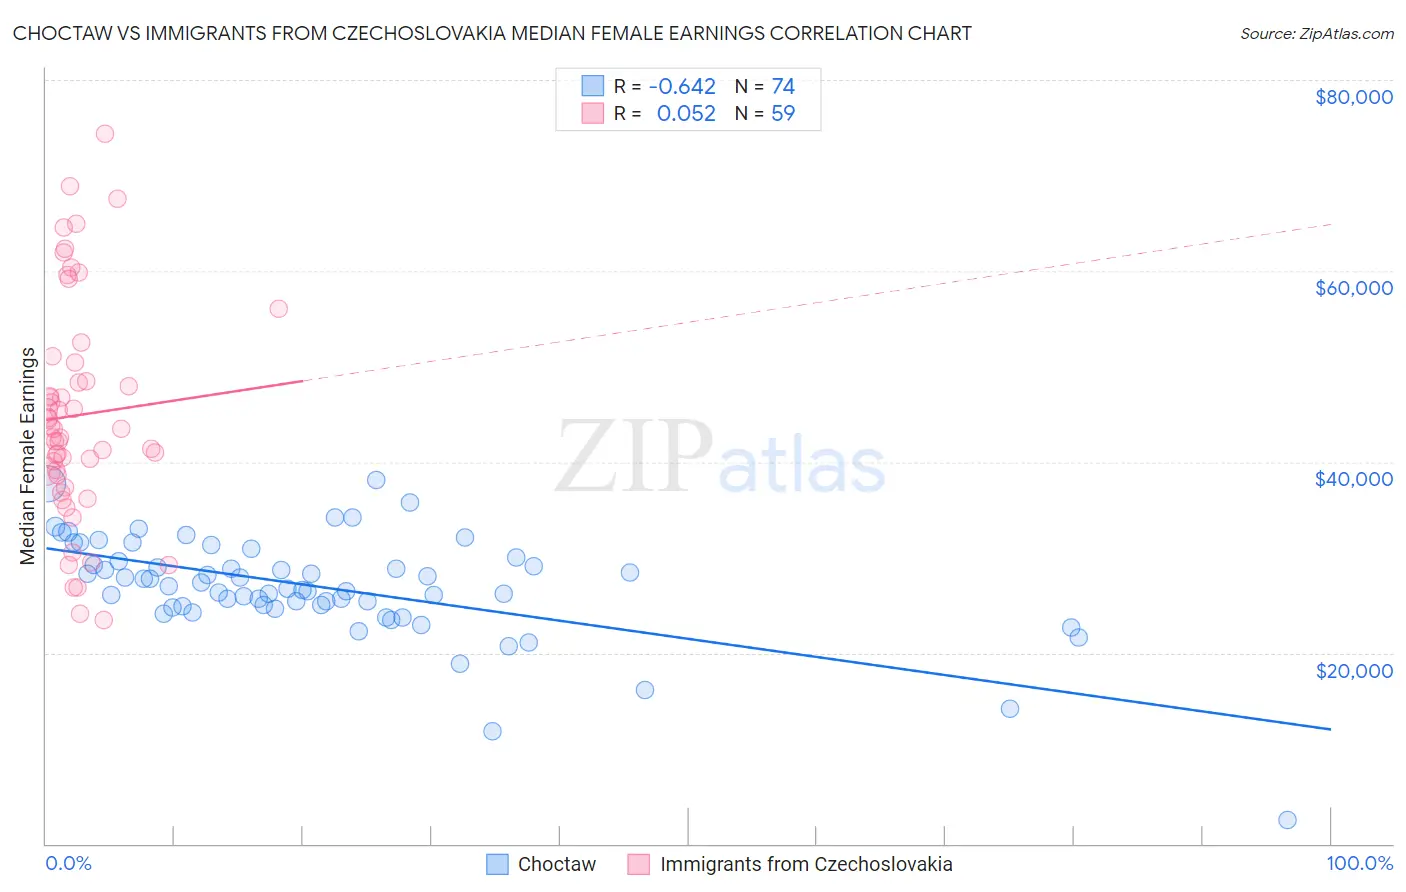
Choctaw vs Immigrants from Czechoslovakia Median Female Earnings Correlation Chart
The statistical analysis conducted on geographies consisting of 269,561,547 people shows a significant negative correlation between the proportion of Choctaw and median female earnings in the United States with a correlation coefficient (R) of -0.642 and weighted average of $33,775. Similarly, the statistical analysis conducted on geographies consisting of 195,434,199 people shows a slight positive correlation between the proportion of Immigrants from Czechoslovakia and median female earnings in the United States with a correlation coefficient (R) of 0.052 and weighted average of $43,571, a difference of 29.0%.
Median Female Earnings Correlation Summary
| Measurement | Choctaw | Immigrants from Czechoslovakia |
| Minimum | $2,499 | $23,424 |
| Maximum | $38,125 | $74,375 |
| Range | $35,626 | $50,951 |
| Mean | $26,859 | $44,894 |
| Median | $26,812 | $43,456 |
| Interquartile 25% (IQ1) | $24,870 | $38,665 |
| Interquartile 75% (IQ3) | $29,604 | $50,450 |
| Interquartile Range (IQR) | $4,734 | $11,786 |
| Standard Deviation (Sample) | $5,513 | $11,575 |
| Standard Deviation (Population) | $5,475 | $11,476 |
Similar Demographics by Median Female Earnings
Demographics Similar to Choctaw by Median Female Earnings
In terms of median female earnings, the demographic groups most similar to Choctaw are Native/Alaskan ($33,806, a difference of 0.090%), Mexican ($33,664, a difference of 0.33%), Menominee ($33,894, a difference of 0.35%), Spanish American Indian ($33,625, a difference of 0.45%), and Hopi ($33,932, a difference of 0.46%).
| Demographics | Rating | Rank | Median Female Earnings |
| Dutch West Indians | 0.0 /100 | #325 | Tragic $34,106 |
| Kiowa | 0.0 /100 | #326 | Tragic $34,074 |
| Cajuns | 0.0 /100 | #327 | Tragic $34,034 |
| Immigrants | Central America | 0.0 /100 | #328 | Tragic $33,953 |
| Hopi | 0.0 /100 | #329 | Tragic $33,932 |
| Menominee | 0.0 /100 | #330 | Tragic $33,894 |
| Natives/Alaskans | 0.0 /100 | #331 | Tragic $33,806 |
| Choctaw | 0.0 /100 | #332 | Tragic $33,775 |
| Mexicans | 0.0 /100 | #333 | Tragic $33,664 |
| Spanish American Indians | 0.0 /100 | #334 | Tragic $33,625 |
| Creek | 0.0 /100 | #335 | Tragic $33,437 |
| Ottawa | 0.0 /100 | #336 | Tragic $33,378 |
| Yakama | 0.0 /100 | #337 | Tragic $33,354 |
| Immigrants | Cuba | 0.0 /100 | #338 | Tragic $33,291 |
| Immigrants | Mexico | 0.0 /100 | #339 | Tragic $33,236 |
Demographics Similar to Immigrants from Czechoslovakia by Median Female Earnings
In terms of median female earnings, the demographic groups most similar to Immigrants from Czechoslovakia are Immigrants from Europe ($43,523, a difference of 0.11%), Bulgarian ($43,638, a difference of 0.15%), Immigrants from Denmark ($43,646, a difference of 0.17%), Bhutanese ($43,648, a difference of 0.18%), and Immigrants from Bolivia ($43,467, a difference of 0.24%).
| Demographics | Rating | Rank | Median Female Earnings |
| Immigrants | Switzerland | 100.0 /100 | #37 | Exceptional $43,996 |
| Latvians | 100.0 /100 | #38 | Exceptional $43,941 |
| Israelis | 100.0 /100 | #39 | Exceptional $43,852 |
| Immigrants | Malaysia | 100.0 /100 | #40 | Exceptional $43,835 |
| Bhutanese | 100.0 /100 | #41 | Exceptional $43,648 |
| Immigrants | Denmark | 100.0 /100 | #42 | Exceptional $43,646 |
| Bulgarians | 100.0 /100 | #43 | Exceptional $43,638 |
| Immigrants | Czechoslovakia | 100.0 /100 | #44 | Exceptional $43,571 |
| Immigrants | Europe | 100.0 /100 | #45 | Exceptional $43,523 |
| Immigrants | Bolivia | 100.0 /100 | #46 | Exceptional $43,467 |
| Bolivians | 100.0 /100 | #47 | Exceptional $43,445 |
| Immigrants | Indonesia | 100.0 /100 | #48 | Exceptional $43,412 |
| Immigrants | Serbia | 100.0 /100 | #49 | Exceptional $43,385 |
| Immigrants | Uzbekistan | 100.0 /100 | #50 | Exceptional $43,363 |
| Maltese | 100.0 /100 | #51 | Exceptional $43,357 |