Yuman vs Immigrants from Eritrea Median Female Earnings
COMPARE
Yuman
Immigrants from Eritrea
Median Female Earnings
Median Female Earnings Comparison
Yuman
Immigrants from Eritrea
$35,377
MEDIAN FEMALE EARNINGS
0.0/ 100
METRIC RATING
300th/ 347
METRIC RANK
$41,485
MEDIAN FEMALE EARNINGS
97.6/ 100
METRIC RATING
106th/ 347
METRIC RANK
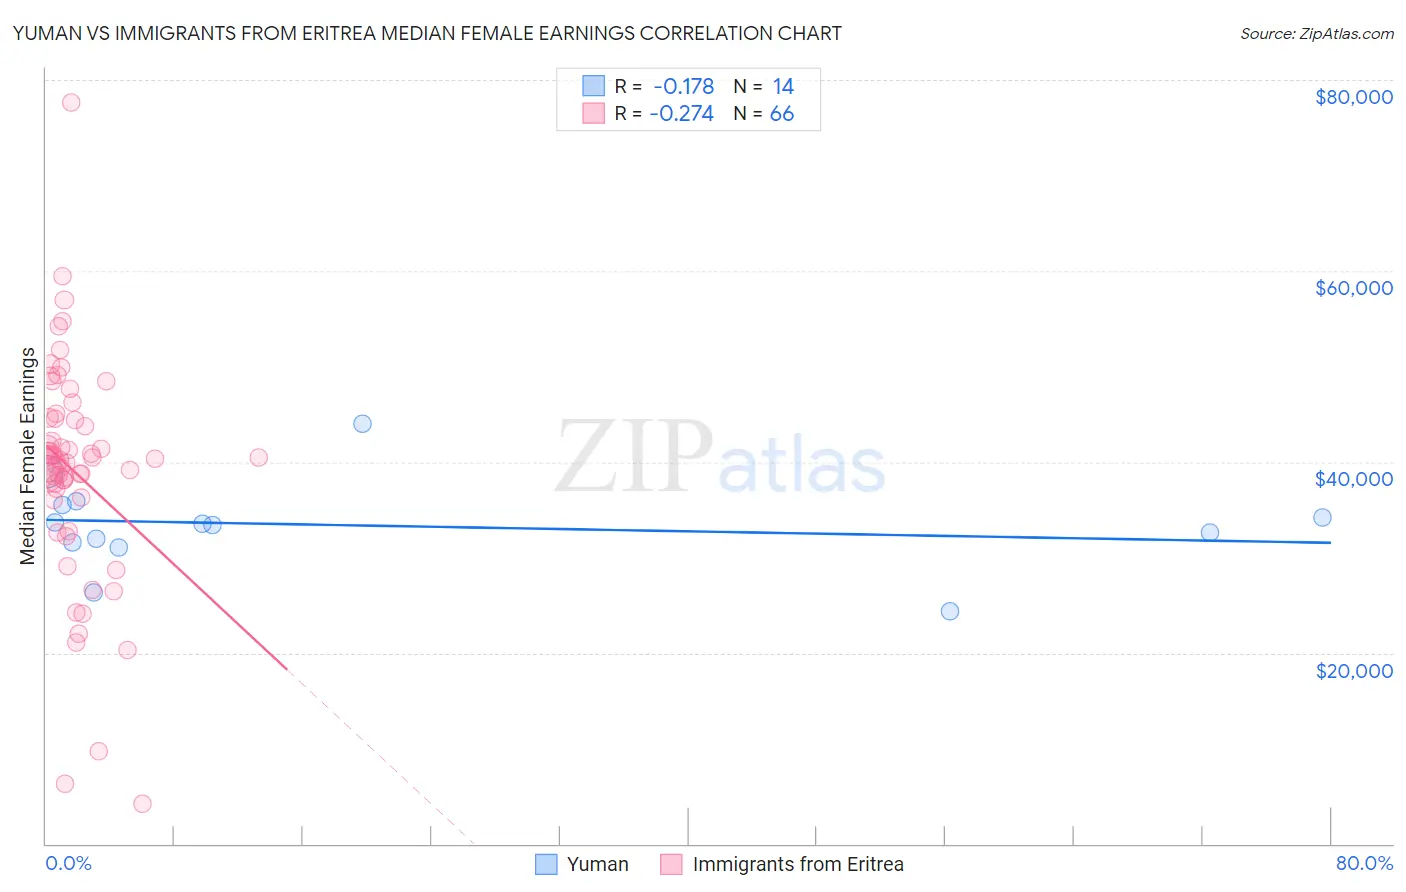
Yuman vs Immigrants from Eritrea Median Female Earnings Correlation Chart
The statistical analysis conducted on geographies consisting of 40,678,701 people shows a poor negative correlation between the proportion of Yuman and median female earnings in the United States with a correlation coefficient (R) of -0.178 and weighted average of $35,377. Similarly, the statistical analysis conducted on geographies consisting of 104,836,938 people shows a weak negative correlation between the proportion of Immigrants from Eritrea and median female earnings in the United States with a correlation coefficient (R) of -0.274 and weighted average of $41,485, a difference of 17.3%.
Median Female Earnings Correlation Summary
| Measurement | Yuman | Immigrants from Eritrea |
| Minimum | $24,415 | $4,132 |
| Maximum | $43,952 | $77,694 |
| Range | $19,537 | $73,562 |
| Mean | $33,355 | $38,981 |
| Median | $33,435 | $40,245 |
| Interquartile 25% (IQ1) | $31,604 | $36,285 |
| Interquartile 75% (IQ3) | $35,454 | $44,525 |
| Interquartile Range (IQR) | $3,850 | $8,239 |
| Standard Deviation (Sample) | $4,771 | $11,801 |
| Standard Deviation (Population) | $4,598 | $11,712 |
Similar Demographics by Median Female Earnings
Demographics Similar to Yuman by Median Female Earnings
In terms of median female earnings, the demographic groups most similar to Yuman are Pima ($35,326, a difference of 0.14%), Black/African American ($35,315, a difference of 0.18%), Immigrants from Guatemala ($35,444, a difference of 0.19%), Immigrants from Latin America ($35,307, a difference of 0.20%), and Immigrants from Micronesia ($35,477, a difference of 0.28%).
| Demographics | Rating | Rank | Median Female Earnings |
| Guatemalans | 0.0 /100 | #293 | Tragic $35,695 |
| Cheyenne | 0.0 /100 | #294 | Tragic $35,673 |
| Comanche | 0.0 /100 | #295 | Tragic $35,661 |
| Mexican American Indians | 0.0 /100 | #296 | Tragic $35,629 |
| Hmong | 0.0 /100 | #297 | Tragic $35,498 |
| Immigrants | Micronesia | 0.0 /100 | #298 | Tragic $35,477 |
| Immigrants | Guatemala | 0.0 /100 | #299 | Tragic $35,444 |
| Yuman | 0.0 /100 | #300 | Tragic $35,377 |
| Pima | 0.0 /100 | #301 | Tragic $35,326 |
| Blacks/African Americans | 0.0 /100 | #302 | Tragic $35,315 |
| Immigrants | Latin America | 0.0 /100 | #303 | Tragic $35,307 |
| Crow | 0.0 /100 | #304 | Tragic $35,266 |
| Bahamians | 0.0 /100 | #305 | Tragic $35,125 |
| Fijians | 0.0 /100 | #306 | Tragic $35,114 |
| Sioux | 0.0 /100 | #307 | Tragic $35,063 |
Demographics Similar to Immigrants from Eritrea by Median Female Earnings
In terms of median female earnings, the demographic groups most similar to Immigrants from Eritrea are Palestinian ($41,484, a difference of 0.0%), Italian ($41,505, a difference of 0.050%), Jordanian ($41,464, a difference of 0.050%), Chinese ($41,461, a difference of 0.060%), and Immigrants from Zimbabwe ($41,527, a difference of 0.10%).
| Demographics | Rating | Rank | Median Female Earnings |
| Immigrants | Barbados | 98.4 /100 | #99 | Exceptional $41,685 |
| Romanians | 98.3 /100 | #100 | Exceptional $41,663 |
| Immigrants | Fiji | 98.3 /100 | #101 | Exceptional $41,656 |
| Immigrants | Poland | 98.2 /100 | #102 | Exceptional $41,630 |
| Immigrants | Argentina | 97.9 /100 | #103 | Exceptional $41,554 |
| Immigrants | Zimbabwe | 97.8 /100 | #104 | Exceptional $41,527 |
| Italians | 97.7 /100 | #105 | Exceptional $41,505 |
| Immigrants | Eritrea | 97.6 /100 | #106 | Exceptional $41,485 |
| Palestinians | 97.6 /100 | #107 | Exceptional $41,484 |
| Jordanians | 97.5 /100 | #108 | Exceptional $41,464 |
| Chinese | 97.5 /100 | #109 | Exceptional $41,461 |
| Immigrants | Western Asia | 97.0 /100 | #110 | Exceptional $41,375 |
| Immigrants | Canada | 97.0 /100 | #111 | Exceptional $41,373 |
| Immigrants | North America | 96.7 /100 | #112 | Exceptional $41,319 |
| Macedonians | 96.4 /100 | #113 | Exceptional $41,286 |