Choctaw vs Native Hawaiian Median Female Earnings
COMPARE
Choctaw
Native Hawaiian
Median Female Earnings
Median Female Earnings Comparison
Choctaw
Native Hawaiians
$33,775
MEDIAN FEMALE EARNINGS
0.0/ 100
METRIC RATING
332nd/ 347
METRIC RANK
$38,461
MEDIAN FEMALE EARNINGS
7.1/ 100
METRIC RATING
224th/ 347
METRIC RANK
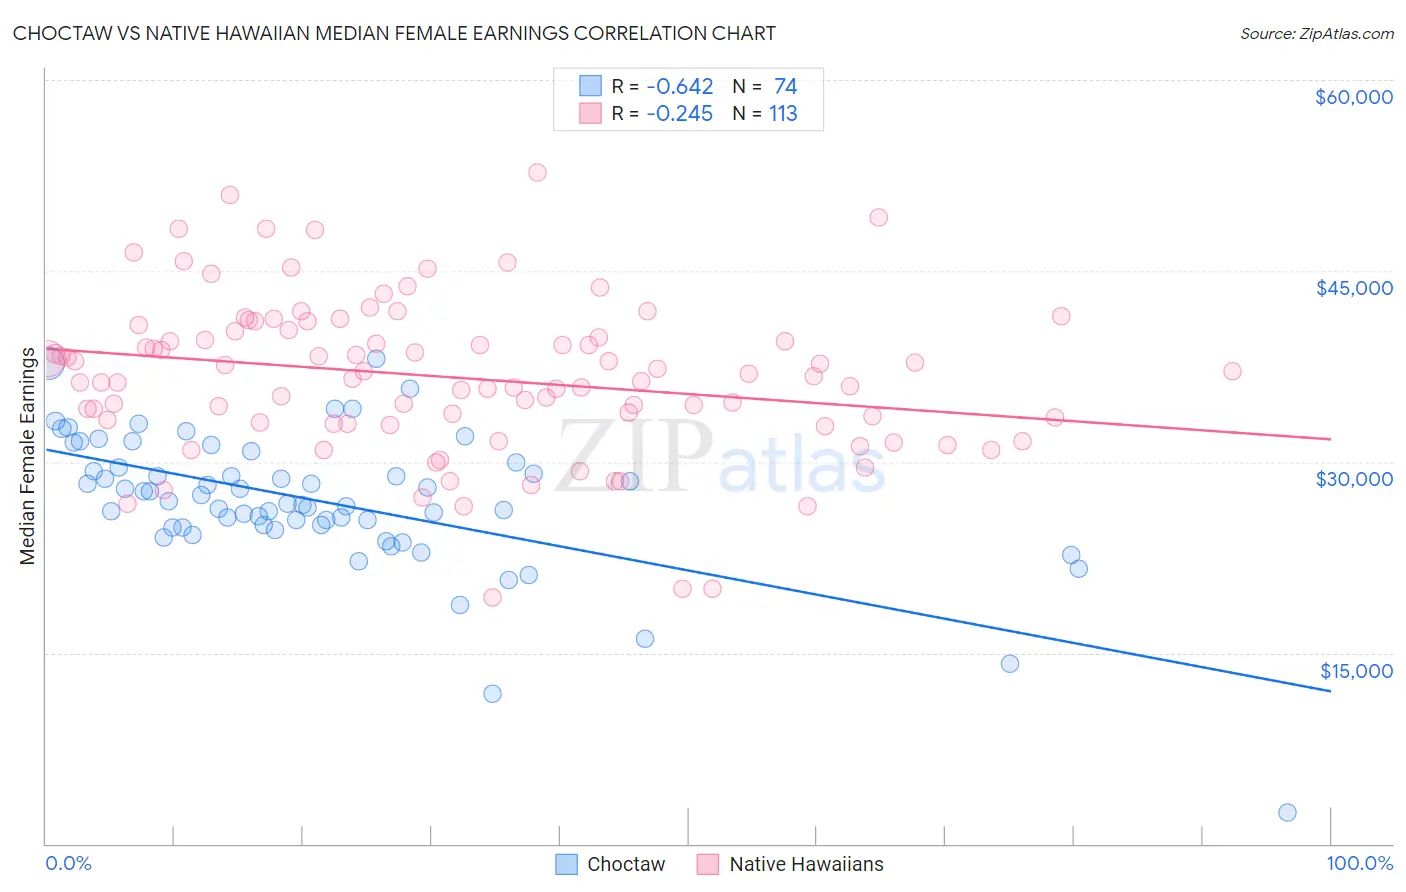
Choctaw vs Native Hawaiian Median Female Earnings Correlation Chart
The statistical analysis conducted on geographies consisting of 269,561,547 people shows a significant negative correlation between the proportion of Choctaw and median female earnings in the United States with a correlation coefficient (R) of -0.642 and weighted average of $33,775. Similarly, the statistical analysis conducted on geographies consisting of 331,982,938 people shows a weak negative correlation between the proportion of Native Hawaiians and median female earnings in the United States with a correlation coefficient (R) of -0.245 and weighted average of $38,461, a difference of 13.9%.
Median Female Earnings Correlation Summary
| Measurement | Choctaw | Native Hawaiian |
| Minimum | $2,499 | $19,330 |
| Maximum | $38,125 | $52,779 |
| Range | $35,626 | $33,449 |
| Mean | $26,859 | $36,634 |
| Median | $26,812 | $36,735 |
| Interquartile 25% (IQ1) | $24,870 | $33,052 |
| Interquartile 75% (IQ3) | $29,604 | $40,312 |
| Interquartile Range (IQR) | $4,734 | $7,259 |
| Standard Deviation (Sample) | $5,513 | $6,153 |
| Standard Deviation (Population) | $5,475 | $6,125 |
Similar Demographics by Median Female Earnings
Demographics Similar to Choctaw by Median Female Earnings
In terms of median female earnings, the demographic groups most similar to Choctaw are Native/Alaskan ($33,806, a difference of 0.090%), Mexican ($33,664, a difference of 0.33%), Menominee ($33,894, a difference of 0.35%), Spanish American Indian ($33,625, a difference of 0.45%), and Hopi ($33,932, a difference of 0.46%).
| Demographics | Rating | Rank | Median Female Earnings |
| Dutch West Indians | 0.0 /100 | #325 | Tragic $34,106 |
| Kiowa | 0.0 /100 | #326 | Tragic $34,074 |
| Cajuns | 0.0 /100 | #327 | Tragic $34,034 |
| Immigrants | Central America | 0.0 /100 | #328 | Tragic $33,953 |
| Hopi | 0.0 /100 | #329 | Tragic $33,932 |
| Menominee | 0.0 /100 | #330 | Tragic $33,894 |
| Natives/Alaskans | 0.0 /100 | #331 | Tragic $33,806 |
| Choctaw | 0.0 /100 | #332 | Tragic $33,775 |
| Mexicans | 0.0 /100 | #333 | Tragic $33,664 |
| Spanish American Indians | 0.0 /100 | #334 | Tragic $33,625 |
| Creek | 0.0 /100 | #335 | Tragic $33,437 |
| Ottawa | 0.0 /100 | #336 | Tragic $33,378 |
| Yakama | 0.0 /100 | #337 | Tragic $33,354 |
| Immigrants | Cuba | 0.0 /100 | #338 | Tragic $33,291 |
| Immigrants | Mexico | 0.0 /100 | #339 | Tragic $33,236 |
Demographics Similar to Native Hawaiians by Median Female Earnings
In terms of median female earnings, the demographic groups most similar to Native Hawaiians are French ($38,457, a difference of 0.010%), French Canadian ($38,436, a difference of 0.060%), Immigrants from Sudan ($38,511, a difference of 0.13%), Japanese ($38,528, a difference of 0.17%), and Scottish ($38,397, a difference of 0.17%).
| Demographics | Rating | Rank | Median Female Earnings |
| Immigrants | Jamaica | 9.7 /100 | #217 | Tragic $38,625 |
| Cape Verdeans | 9.5 /100 | #218 | Tragic $38,614 |
| Nepalese | 9.3 /100 | #219 | Tragic $38,603 |
| Yugoslavians | 8.8 /100 | #220 | Tragic $38,573 |
| Immigrants | Azores | 8.8 /100 | #221 | Tragic $38,573 |
| Japanese | 8.1 /100 | #222 | Tragic $38,528 |
| Immigrants | Sudan | 7.8 /100 | #223 | Tragic $38,511 |
| Native Hawaiians | 7.1 /100 | #224 | Tragic $38,461 |
| French | 7.0 /100 | #225 | Tragic $38,457 |
| French Canadians | 6.8 /100 | #226 | Tragic $38,436 |
| Scottish | 6.3 /100 | #227 | Tragic $38,397 |
| Sub-Saharan Africans | 6.2 /100 | #228 | Tragic $38,391 |
| Belgians | 6.1 /100 | #229 | Tragic $38,382 |
| Basques | 5.7 /100 | #230 | Tragic $38,352 |
| Somalis | 5.5 /100 | #231 | Tragic $38,333 |