Chippewa vs Cypriot Median Female Earnings
COMPARE
Chippewa
Cypriot
Median Female Earnings
Median Female Earnings Comparison
Chippewa
Cypriots
$35,003
MEDIAN FEMALE EARNINGS
0.0/ 100
METRIC RATING
310th/ 347
METRIC RANK
$45,570
MEDIAN FEMALE EARNINGS
100.0/ 100
METRIC RATING
18th/ 347
METRIC RANK
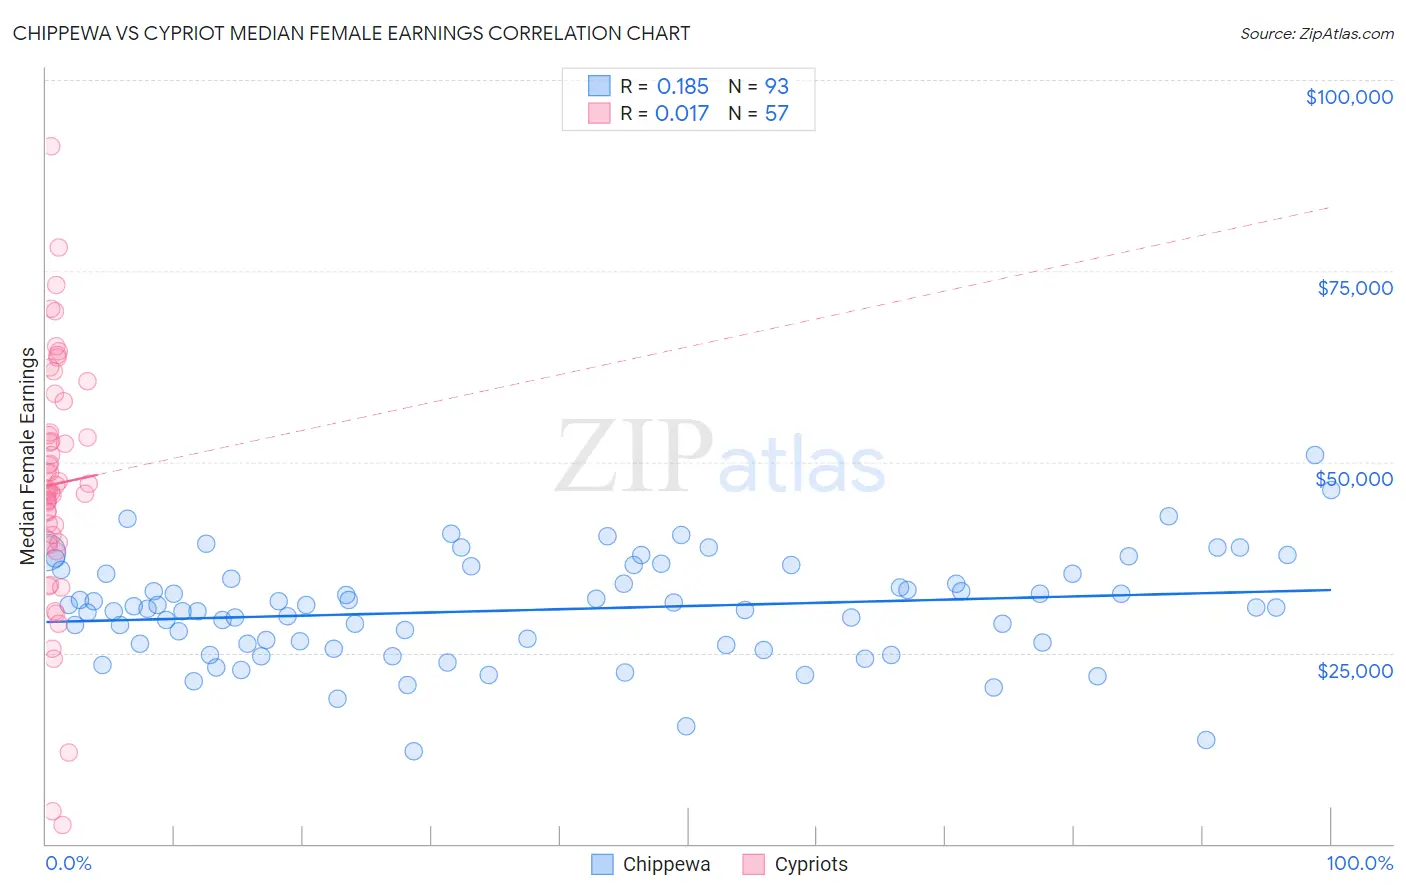
Chippewa vs Cypriot Median Female Earnings Correlation Chart
The statistical analysis conducted on geographies consisting of 214,968,178 people shows a poor positive correlation between the proportion of Chippewa and median female earnings in the United States with a correlation coefficient (R) of 0.185 and weighted average of $35,003. Similarly, the statistical analysis conducted on geographies consisting of 61,860,618 people shows no correlation between the proportion of Cypriots and median female earnings in the United States with a correlation coefficient (R) of 0.017 and weighted average of $45,570, a difference of 30.2%.
Median Female Earnings Correlation Summary
| Measurement | Chippewa | Cypriot |
| Minimum | $12,188 | $2,499 |
| Maximum | $50,958 | $91,382 |
| Range | $38,770 | $88,883 |
| Mean | $30,628 | $47,121 |
| Median | $30,893 | $46,430 |
| Interquartile 25% (IQ1) | $26,067 | $39,556 |
| Interquartile 75% (IQ3) | $35,324 | $55,932 |
| Interquartile Range (IQR) | $9,258 | $16,376 |
| Standard Deviation (Sample) | $6,851 | $16,285 |
| Standard Deviation (Population) | $6,814 | $16,141 |
Similar Demographics by Median Female Earnings
Demographics Similar to Chippewa by Median Female Earnings
In terms of median female earnings, the demographic groups most similar to Chippewa are Honduran ($35,013, a difference of 0.030%), Immigrants from Bahamas ($35,027, a difference of 0.070%), Ute ($34,960, a difference of 0.12%), Sioux ($35,063, a difference of 0.17%), and Yaqui ($34,943, a difference of 0.17%).
| Demographics | Rating | Rank | Median Female Earnings |
| Immigrants | Latin America | 0.0 /100 | #303 | Tragic $35,307 |
| Crow | 0.0 /100 | #304 | Tragic $35,266 |
| Bahamians | 0.0 /100 | #305 | Tragic $35,125 |
| Fijians | 0.0 /100 | #306 | Tragic $35,114 |
| Sioux | 0.0 /100 | #307 | Tragic $35,063 |
| Immigrants | Bahamas | 0.0 /100 | #308 | Tragic $35,027 |
| Hondurans | 0.0 /100 | #309 | Tragic $35,013 |
| Chippewa | 0.0 /100 | #310 | Tragic $35,003 |
| Ute | 0.0 /100 | #311 | Tragic $34,960 |
| Yaqui | 0.0 /100 | #312 | Tragic $34,943 |
| Cubans | 0.0 /100 | #313 | Tragic $34,942 |
| Apache | 0.0 /100 | #314 | Tragic $34,895 |
| Pennsylvania Germans | 0.0 /100 | #315 | Tragic $34,802 |
| Cherokee | 0.0 /100 | #316 | Tragic $34,742 |
| Potawatomi | 0.0 /100 | #317 | Tragic $34,739 |
Demographics Similar to Cypriots by Median Female Earnings
In terms of median female earnings, the demographic groups most similar to Cypriots are Eastern European ($45,385, a difference of 0.41%), Immigrants from Japan ($45,323, a difference of 0.55%), Cambodian ($45,014, a difference of 1.2%), Immigrants from Greece ($44,976, a difference of 1.3%), and Burmese ($44,911, a difference of 1.5%).
| Demographics | Rating | Rank | Median Female Earnings |
| Okinawans | 100.0 /100 | #11 | Exceptional $46,905 |
| Immigrants | Israel | 100.0 /100 | #12 | Exceptional $46,902 |
| Immigrants | Australia | 100.0 /100 | #13 | Exceptional $46,573 |
| Soviet Union | 100.0 /100 | #14 | Exceptional $46,556 |
| Immigrants | Eastern Asia | 100.0 /100 | #15 | Exceptional $46,502 |
| Indians (Asian) | 100.0 /100 | #16 | Exceptional $46,481 |
| Immigrants | South Central Asia | 100.0 /100 | #17 | Exceptional $46,324 |
| Cypriots | 100.0 /100 | #18 | Exceptional $45,570 |
| Eastern Europeans | 100.0 /100 | #19 | Exceptional $45,385 |
| Immigrants | Japan | 100.0 /100 | #20 | Exceptional $45,323 |
| Cambodians | 100.0 /100 | #21 | Exceptional $45,014 |
| Immigrants | Greece | 100.0 /100 | #22 | Exceptional $44,976 |
| Burmese | 100.0 /100 | #23 | Exceptional $44,911 |
| Immigrants | Korea | 100.0 /100 | #24 | Exceptional $44,847 |
| Immigrants | Sweden | 100.0 /100 | #25 | Exceptional $44,774 |